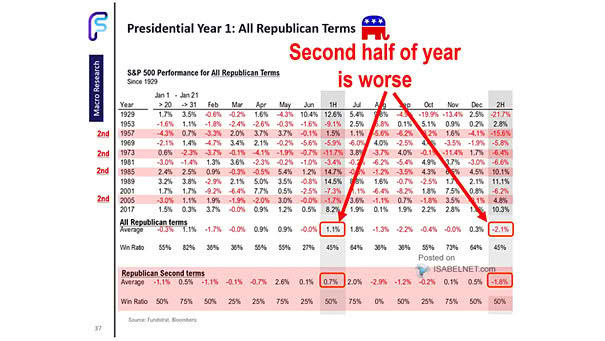
S&P 500 Performance for All Republican Terms
S&P 500 Performance for All Republican Terms In Republican presidential terms, the S&P 500 tends to perform worse in the second half of the first year than in the first half, as policy impacts and economic realities set in. Image: Fundstrat Global Advisors, LLC