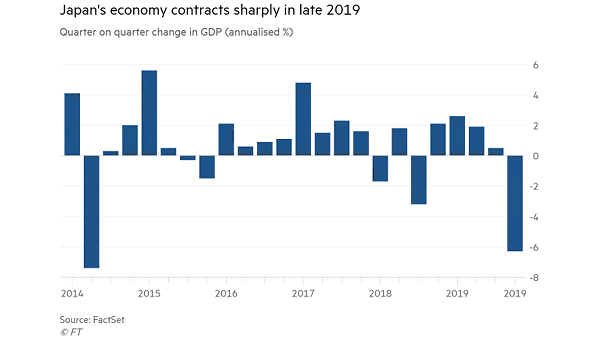
Average S&P 500 Performance in Fed Tightening Cycles
Average S&P 500 Performance in Fed Tightening Cycles S&P 500 weakness tends to materialise 9-10 months after the first Fed rate hike and tends to last a year. Image: Deutsche Bank
Inflation – U.S. Trimmed and Median CPI Trimmed and median CPI remain sticky so far, which suggests that further rate hikes may be needed to tame inflation. Image: Deutsche Bank
S&P 500 Returns During Extended Fed Hiking Cycles Historically, rate hike cycles tend to be positive for U.S. stocks. But that’s not the case this year. Image: Deutsche Bank Asset Allocation
S&P 500 Earnings vs. Fed Funds Historically, Fed rate hikes tend to impact S&P 500 earnings, which is not good news for U.S. stocks. Image: Real Investment Advice
Change in Financial Conditions Following Major Geopolitical Events Will the Fed delay rate hikes and balance sheet reduction? Image: Goldman Sachs Global Investment Research
Post-GFC Fed Balance Sheet Phases, Fed Funds, UST 10-Year and the S&P 500 Can U.S. stocks survive the Fed’s tapering and rate hikes? Image: Deutsche Bank
Average S&P 500 Performance in Fed Tightening Cycles Around 9 months after the first rate hike, the S&P 500 tends to be flat for over a year. Image: Deutsche Bank
Fed – Expectation for the Tapering Timeline Is it time to talk about tapering quantitative easing and rate hikes? Image: Goldman Sachs Global Investment Research
Valuation – Average Forward P/E in Core PCE Inflation Ranges Since 1976 Historically, inflation generally had a negative impact on valuations when core PCE approached 2%, in the anticipation of rate hikes. Image: Goldman Sachs Global Investment Research
Fed Funds vs. Employment/Population + Inflation This chart suggests the optimal monetary policy, while Fed officials do not anticipate any rate hikes until 2022. Image: Oxford Economics