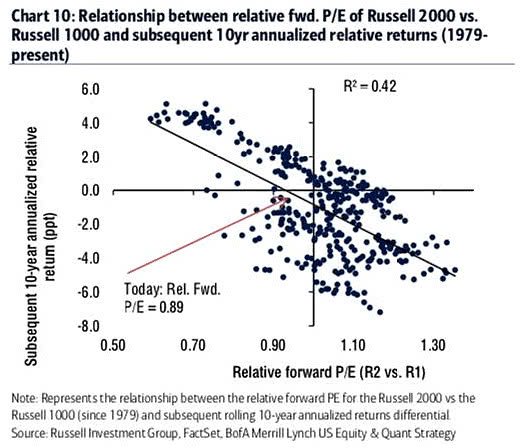
Dec 06 2019 Off Russell 2000 vs. Russell 1000 and Subsequent 10-Year Annualized Relative Returns Chart suggesting that small caps should outperform large caps over the next 10 years (R² = 0.42).Image: BofA Merrill Lynch US Equity & US Quant Strategy