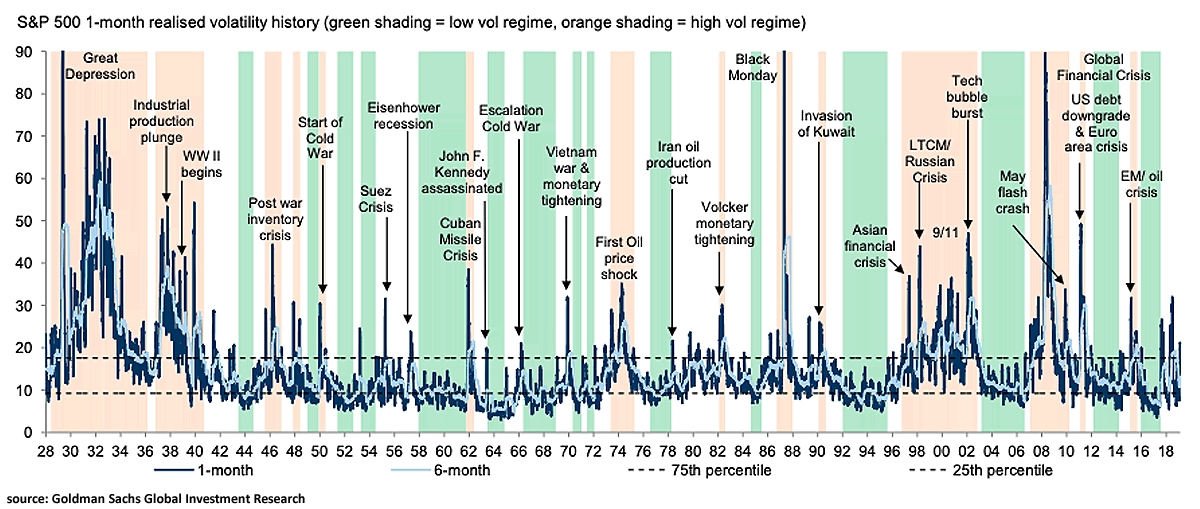
Sep 02 2019 Off S&P 500 1-Month Realised Volatility History This chart shows that the last 90 years have been split equally between high, low and normal volatility regimes.Image: Goldman Sachs Global Investment Research