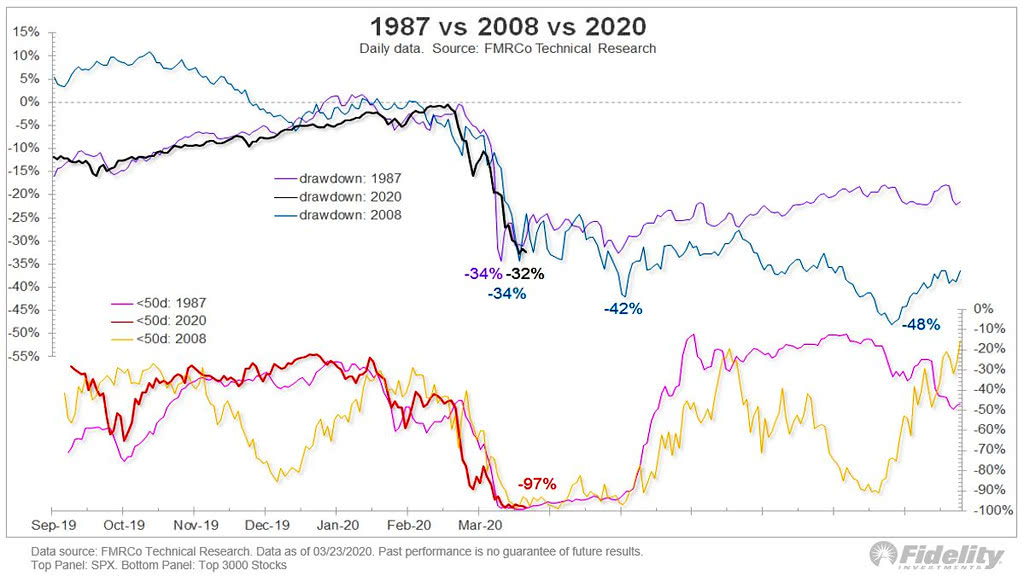
Mar 25 2020 Off S&P 500 - 1987 vs. 2008 vs. 2020 This chart shows the percentage of stocks below their 50-day moving average vs. the 1987 & 2008 drawdowns.Image: Fidelity Investments