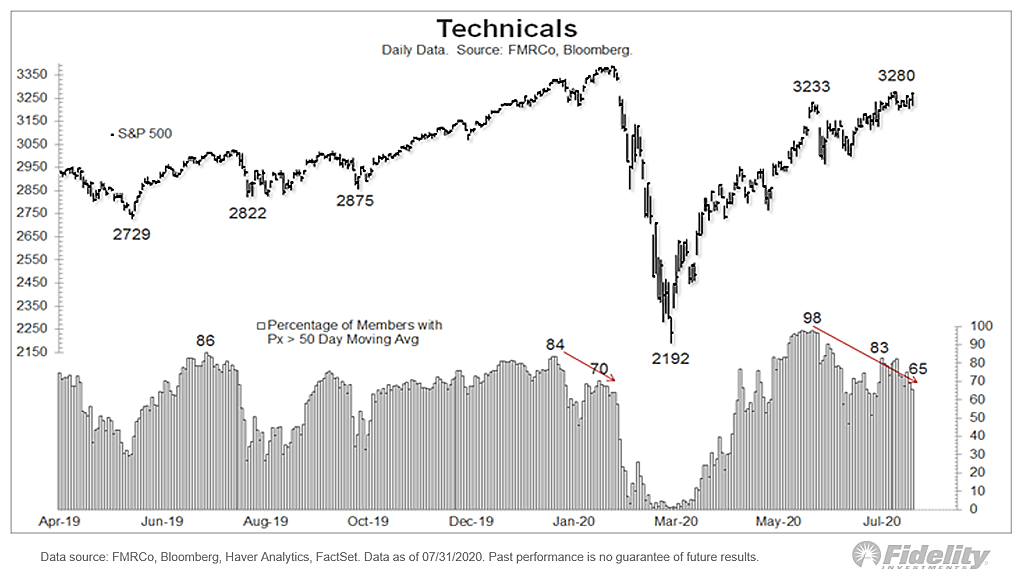
Aug 06 2020 Off S&P 500 vs. Percentage of Stocks Above 50-Day Moving Average Chart showing the current divergence between the S&P 500 and the percentage of stocks trading above their 50-day moving average.Image: Fidelity Investments