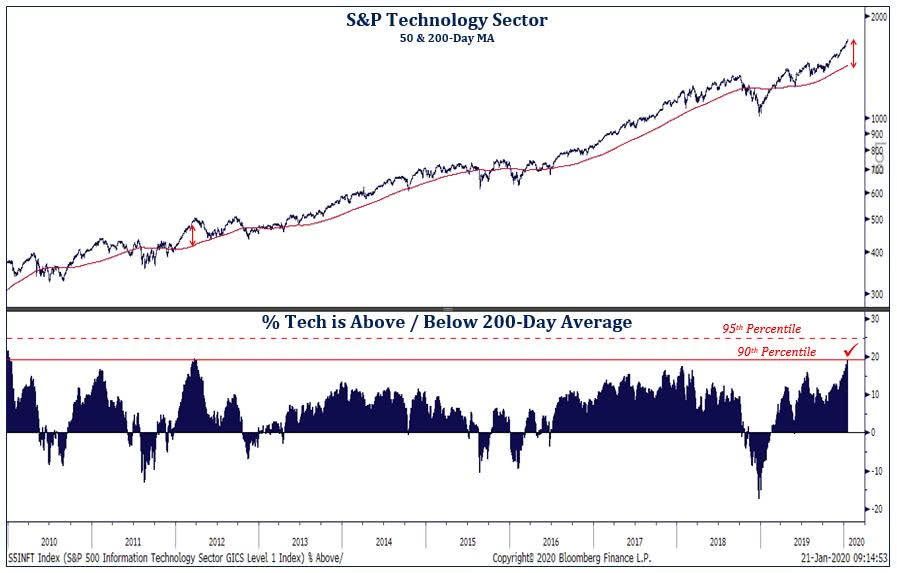
Jan 23 2020 Off S&P Technology Sector and 200-Day Moving Average The chart suggests that the tech sector appears stretched, at nearly 20% above its 200-day moving average.Image: Strategas Research Partners