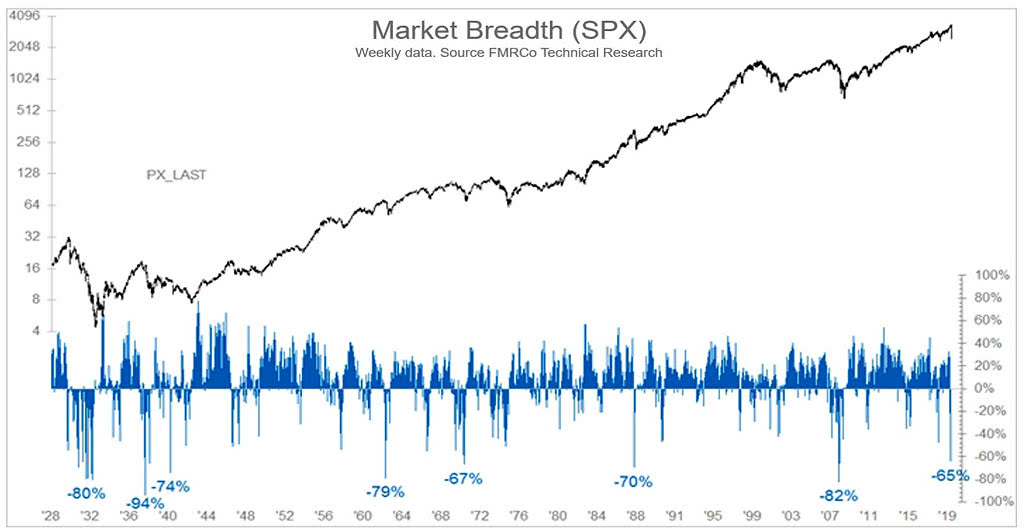
Mar 20 2020 Off Stock Market Breadth (S&P 500) This chart shows that the stock market’s breadth (new 52-week highs/lows) is unusually shallow.Image: Fidelity Investments