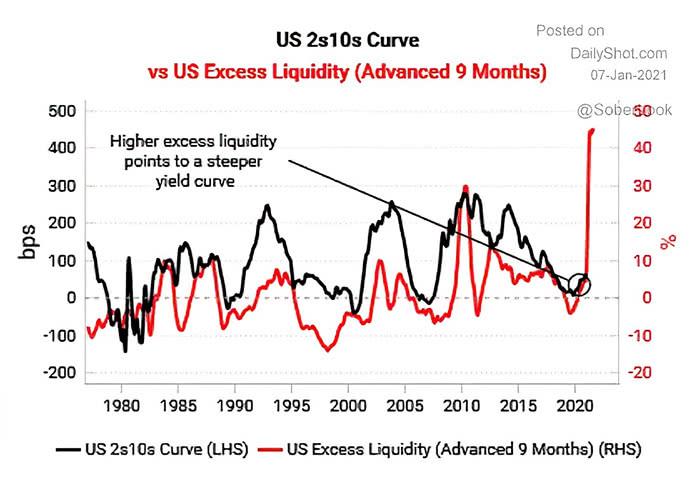
Jan 07 2021 Off U.S. 10Y-2Y Yield Curve vs. U.S. Excess Liquidity (Leading Indicator) U.S. excess liquidity tends to lead the U.S. 10Y-2Y yield curve by 9 months.Image: Variant Perception Research