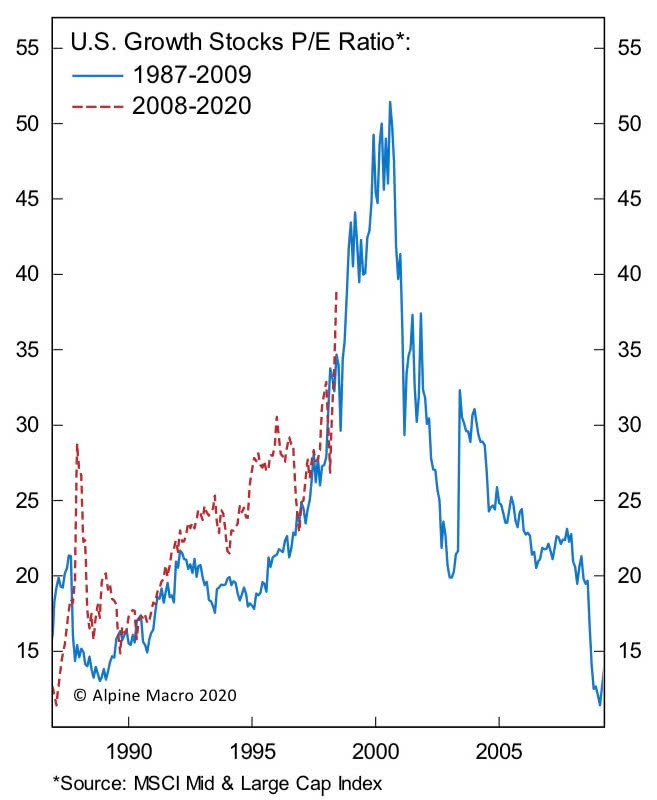
Jul 10 2020
Off
U.S. Growth Stocks P/E Ratio: 1987-2009 vs. 2008-2020
Are growth stocks overvalued? This chart shows the P/E ratio on growth stocks during the dotcom bubble compared to the period 2008-2020.
Image: Alpine Macro
Advanced Stock Market Forecast for Professional and Individual
Connect with Us on Twitter
Are growth stocks overvalued? This chart shows the P/E ratio on growth stocks during the dotcom bubble compared to the period 2008-2020.
Image: Alpine Macro