Sentiment – Risk Appetite and Expected U.S. Equity Market Performance
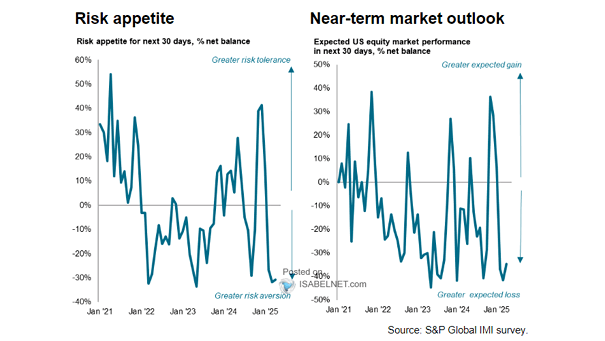
Sentiment – Risk Appetite and Expected U.S. Equity Market Performance Geopolitical tensions are clouding sentiment among U.S. equity fund managers in March, but confidence in the market and the economy remains intact, as many bet the shock will be short-lived. Image: S&P Global Market Intelligence