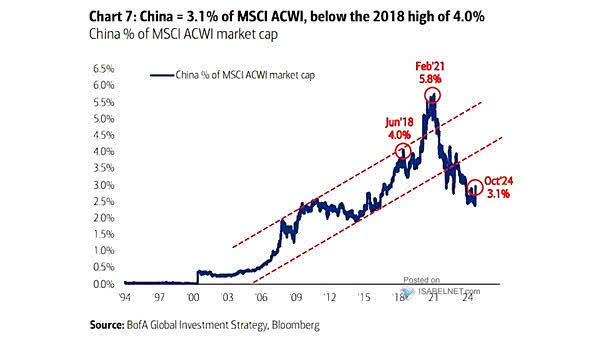
China as % of MSCI ACWI Market Capitalization
China as % of MSCI ACWI Market Capitalization Assuming that China’s market capitalization as a percentage of the MSCI ACWI rises to its 2018 high of 4.0%, this scenario presents a potential upside of approximately 30% for investors. Image: BofA Global Investment Strategy