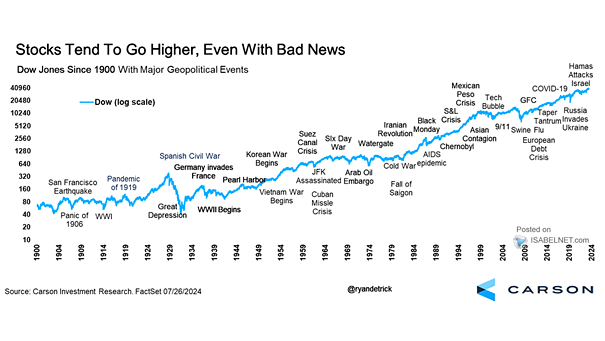
S&P 500 Price Reaction to Previous Military Escalations
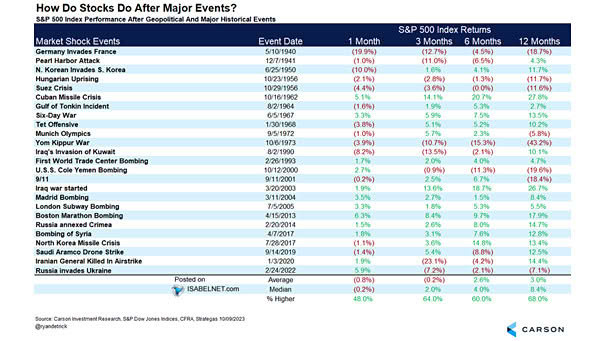
S&P 500 Price Reaction to Previous Military Escalations The headlines may be dramatic, but the market impact is likely to be muted. U.S. equities wobble at first, then settle once investors refocus on fundamentals. In the end, short-term jitters rarely outweigh strong fundamentals. Image: Deutsche Bank Research