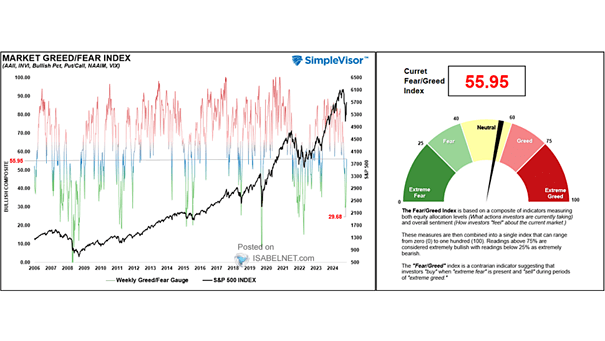
S&P 500 Valuation Multiples

S&P 500 Valuation Multiples With S&P 500 earnings estimates running high and valuations stretched, the risk is that any earnings or economic disappointment could trigger sharp market volatility. Image: Real Investment Advice

Scatter Plot Returns of P/E Multiples and S&P 500 1-Year Returns

Scatter Plot Returns of P/E Multiples and S&P 500 1-Year Returns The weak link between the P/E ratio and the S&P 500’s one-year performance shows why investors are better off keeping their eyes on the long game, not short-term valuations. Image: Carson Investment Research

S&P 500 and Nasdaq vs. 1996-2001 Analog

S&P 500 and Nasdaq vs. 1996-2001 Analog With policy easing expected to run into 2026, will U.S. equities continue to mirror the boom years of 1996 to 2001? Image: Alpine Macro

U.S. High Yield Credit Spreads

U.S. High Yield Credit Spreads Tight high-yield spreads signal strong market confidence, but they also raise red flags by potentially masking underlying vulnerabilities and feeding investor complacency by making risks seem less significant than they are. Image: Topdown Charts

Fear & Greed Index – Investor Sentiment

Fear & Greed Index – Investor Sentiment With a reading of 52, the Fear & Greed Index is neutral, indicating that market participants are neither overly fearful nor overly greedy, but maintain cautious optimism. Image: Cable News Network

AAII Sentiment Survey

AAII Sentiment Survey The AAII bull-bear spread has flipped back into positive territory, hinting at a modest pickup in U.S. retail investor optimism—though sentiment still looks more neutral than outright bullish. Image: The Daily Chartbook

Underlying U.S. Real GDP Growth

Underlying U.S. Real GDP Growth The AI-driven tech boom has kept the U.S. economy from slipping into recession in 2025, but whether the rally can last is far from certain—and a pullback in investment could quickly tip the balance. Image: Deutsche Bank Research

Asset Bubbles – Bitcoin, Equities and Bonds

Asset Bubbles – Bitcoin, Equities and Bonds While caution is always warranted and some assets look frothy, extreme market bubbles are not apparent right now—though pockets of overvaluation do remain. Image: Deutsche Bank Research

NAAIM Exposure Index – Investor Sentiment​

NAAIM Exposure Index – Investor Sentiment At 86.24, the reading points to strong confidence among active managers, who are keeping sizable equity allocations that reflect optimism but stop short of exuberance. The National Association of Active Investment Managers Exposure Index represents the two-week moving average exposure to U.S. equity markets reported by NAAIM members. Image: NAAIM

S&P 500 Earnings and Estimates

S&P 500 Earnings and Estimates Optimism over 2026 earnings is unusually high, increasing the risk of downward revisions in coming quarters. This marks the largest deviation from the long-term earnings growth trend. Image: Real Investment Advice