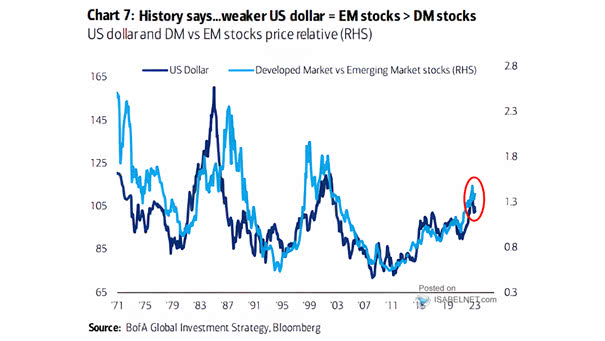
U.S. Dollar and U.S. vs. Emerging Market Stocks
U.S. Dollar and U.S. vs. Emerging Market Stocks When the U.S. dollar is weak, emerging market stocks tend to outperform U.S. stocks. Image: BofA Global Investment Strategy
U.S. Dollar and U.S. vs. Emerging Market Stocks When the U.S. dollar is weak, emerging market stocks tend to outperform U.S. stocks. Image: BofA Global Investment Strategy
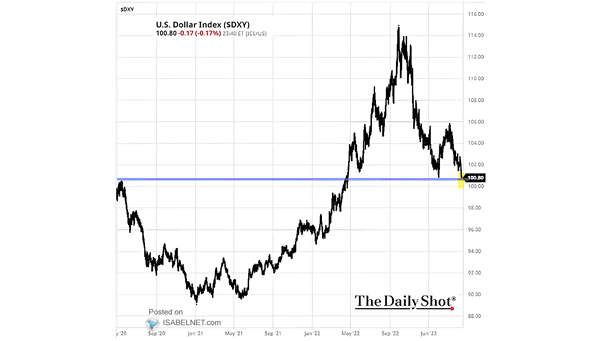
U.S. Dollar Index The U.S. dollar has generally shown a tendency to rebound after hitting major support levels. Image: The Daily Shot
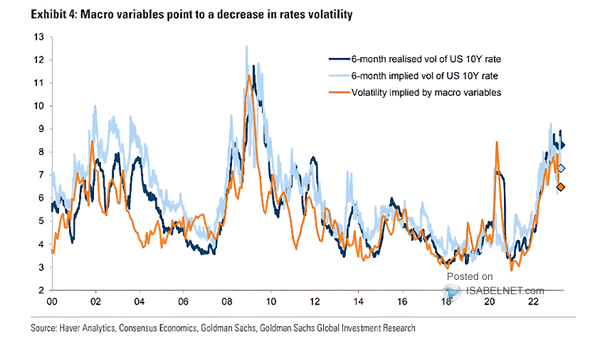
Volatility and Macro Variables Macro variables pointing to a decrease in rates volatility are good news. Image: Goldman Sachs Global Investment Research
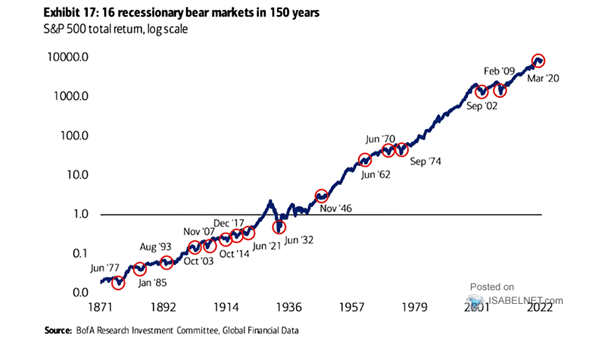
Recessionary Bear Markets – S&P 500 Total Return Recessionary bear market lows can present good buying opportunities for long-term investors. Image: BofA Research Investment Committee
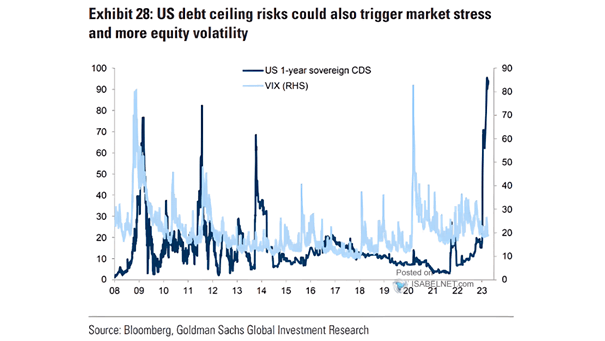
Volatility – VIX and U.S. 1-Year Sovereign CDS The U.S. debt ceiling circus could lead to volatility in financial markets. Image: Goldman Sachs Global Investment Research
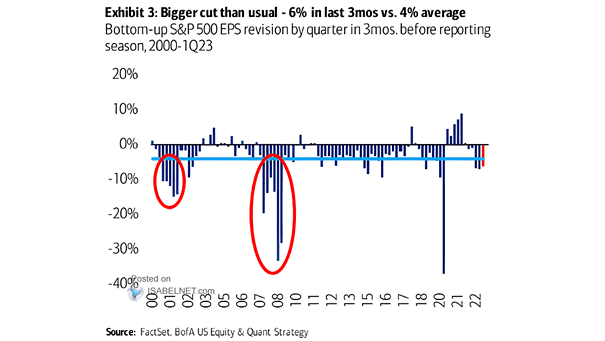
Bottom-Up S&P 500 EPS Revision Will the earnings season drive the S&P 500 up or down? Image: BofA US Equity & Quant Strategy

Fed Funds Rate vs. Recessionary Bear Market Lows Fed rate cuts are historically not bullish for the S&P 500. Image: BofA Research Investment Committee
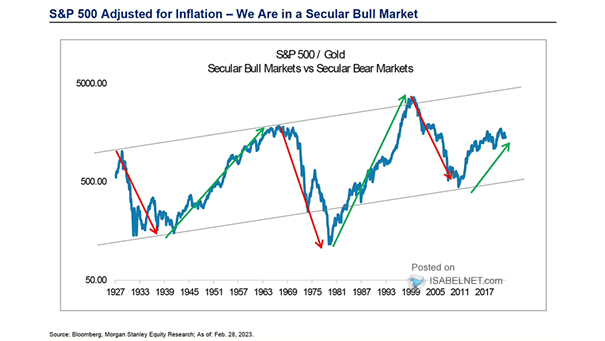
Secular Bull Markets vs. Secular Bear Markets – S&P 500 / Gold Despite occasional market fluctuations and concerns about overvaluation, the S&P 500 is still in a secular bull market. Image: Morgan Stanley Research
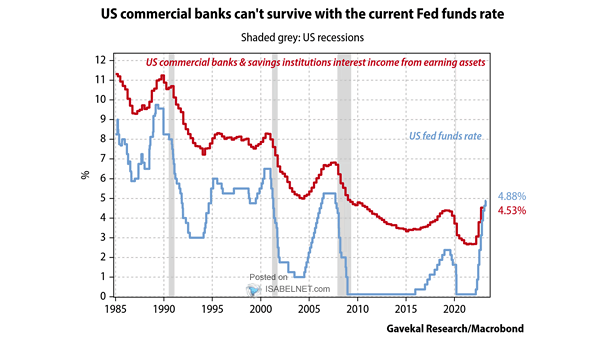
U.S. Commercial Banks and Savings Institutions Interest Income from Earnings Assets vs. U.S. Fed Funds Rate Does it really make sense to keep raising interest rates if U.S. commercial banks can’t survive with the current federal funds rate? Image: Gavekal, Macrobond
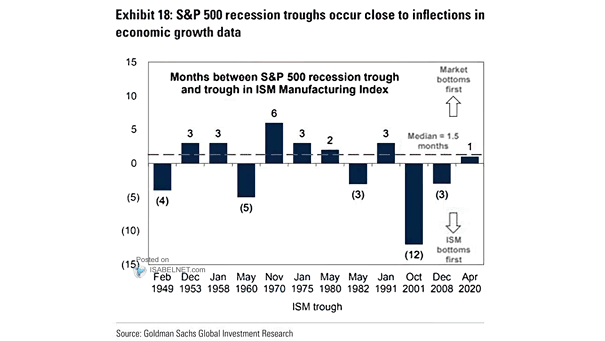
Months Between S&P 500 Recession Trough and Trough in ISM Manufacturing Index Monitoring the ISM Manufacturing Index can be useful for investors who are interested in making decisions about when to invest in the S&P 500. Image: Goldman Sachs Global Investment Research
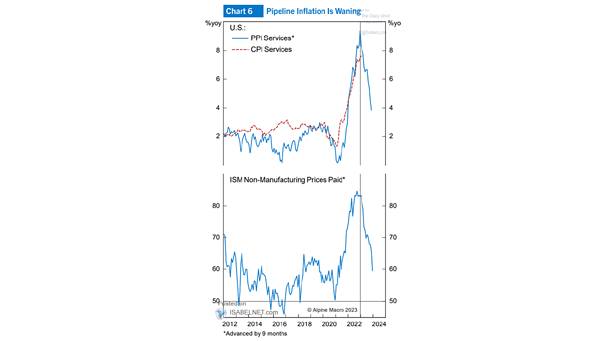
Inflation – CPI Services vs. PPI Services and ISM Non-Manufacturing Prices Paid (Leading Indicator) The ISM Non-Manufacturing Prices Paid and PPI services tend to lead CPI services by 9 months. Image: Alpine Macro