Bloomberg U.S. Financial Conditions Index
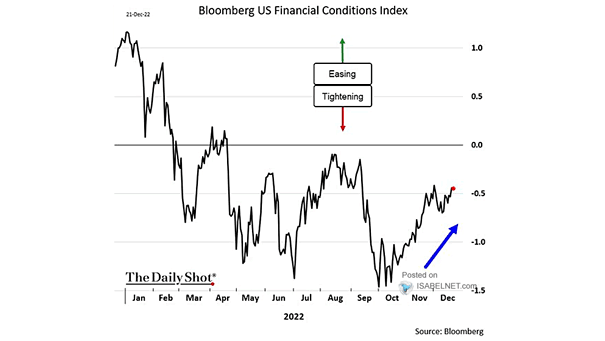
Bloomberg U.S. Financial Conditions Index Looser financial conditions will make it harder for the Fed to bring inflation back to 2%. Image: The Daily Shot
Bloomberg U.S. Financial Conditions Index Looser financial conditions will make it harder for the Fed to bring inflation back to 2%. Image: The Daily Shot
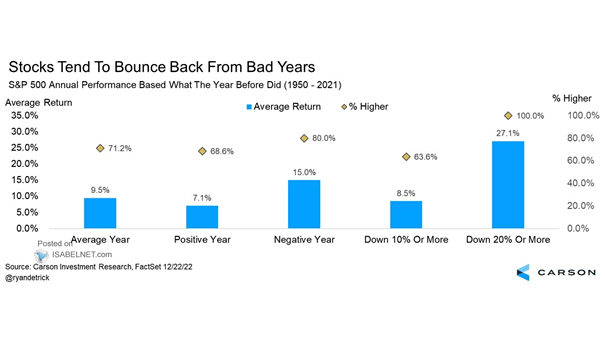
S&P 500 Annual Performance Based What the Year Before Did After a negative year, will the S&P 500 recover in 2023? Image: Carson Investment Research
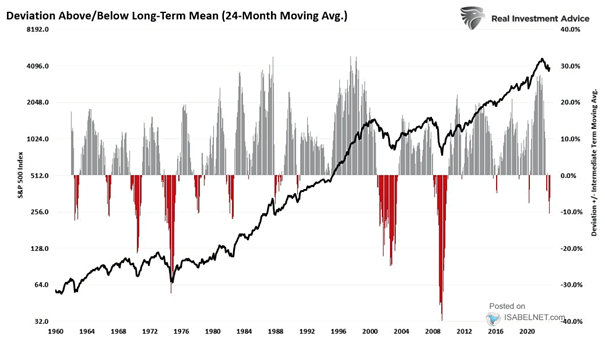
S&P 500 and Deviation Above/Below 24-Month Moving Average Reversion to the mean is a powerful force. Does the S&P 500 have room to fall further? Image: Real Investment Advice
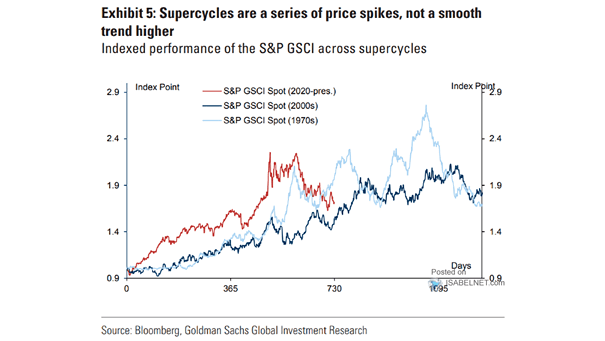
Commodities – Performance of the S&P GSCI Across Supercycles Goldman Sachs expects the S&P Goldman Sachs Commodity Index to return 43% in 2023. Image: Goldman Sachs Global Investment Research
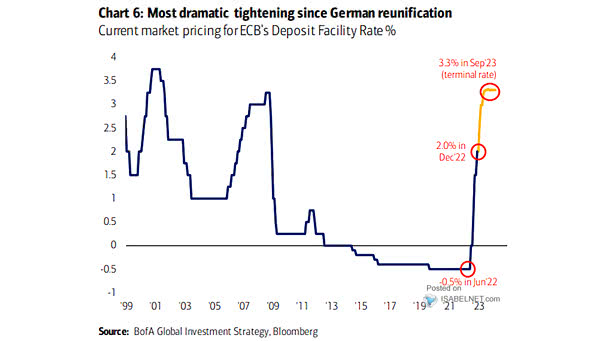
Current Market Pricing for ECB’s Deposit Facility Rate The European Central Bank expects further rate hikes to fight inflation. Image: BofA Global Investment Strategy
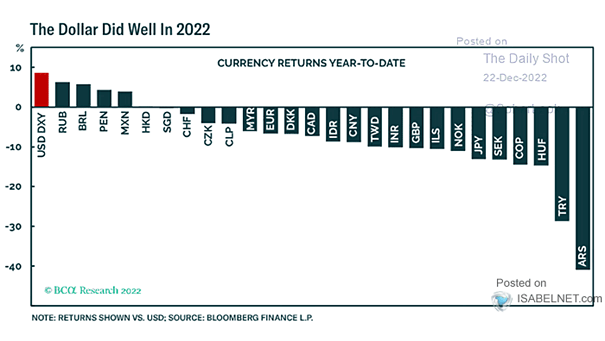
U.S. Dollar – Currency Returns Will the U.S. dollar underperform in 2023? Image: BCA Research
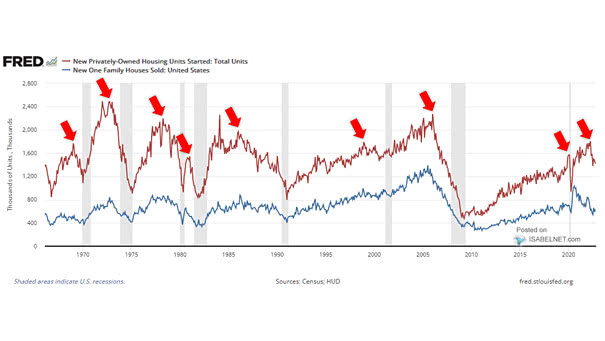
U.S. Housing Starts and New One Family Houses Housing starts declined 0.5% in November. Usually, a continued downturn may signal a contraction of the economy. And historically, a decline in residential real estate has led several recessions. But housing is already in a slump and shouldn’t cause a recession.
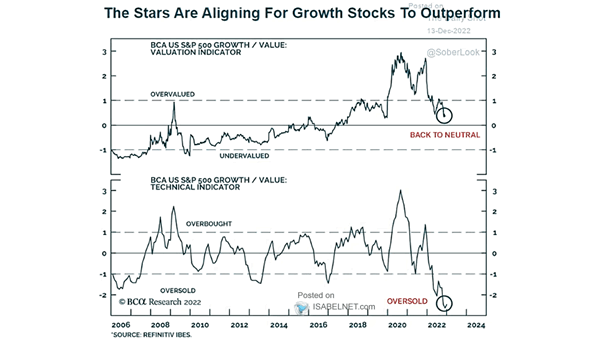
S&P 500 Growth/Value – Valuation and Technical Indicators Should investors expect growth stocks to outperform value stocks? Image: BCA Research
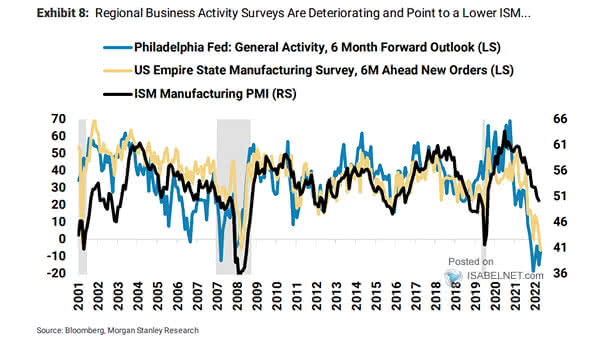
U.S. ISM Manufacturing PMI vs. Philadelphia Fed General Activity vs. U.S. Empire State Manufacturing Survey Regional business activity surveys suggest a lower ISM Manufacturing PMI over the coming months. Image: Morgan Stanley Research
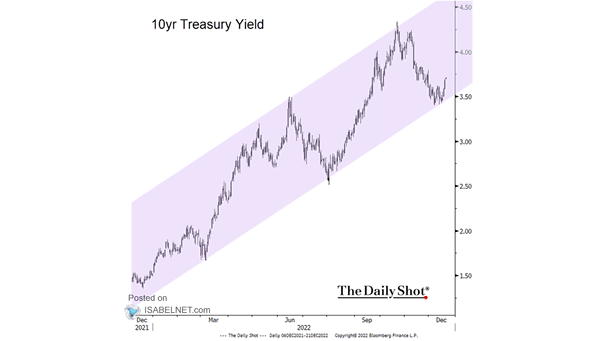
U.S. 10-Year Government Bond Yield Will the 10-year U.S. Treasury yield continue to rise? Image: The Daily Shot
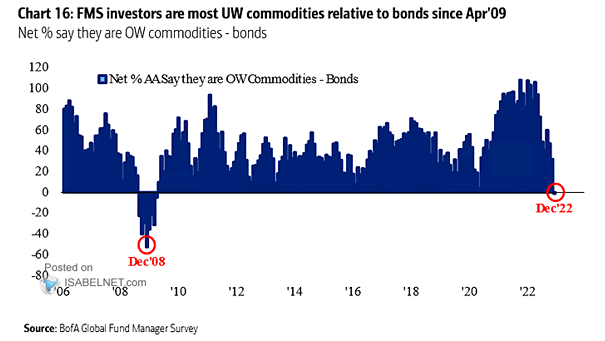
FMS Investors – Net % Say They Are Overweight Commodities Relative to Bonds FMS investors are most underweight commodities relative to bonds. Image: BofA Global Fund Manager Survey