S&P 500 GAAP Earnings (and Forward Estimates)
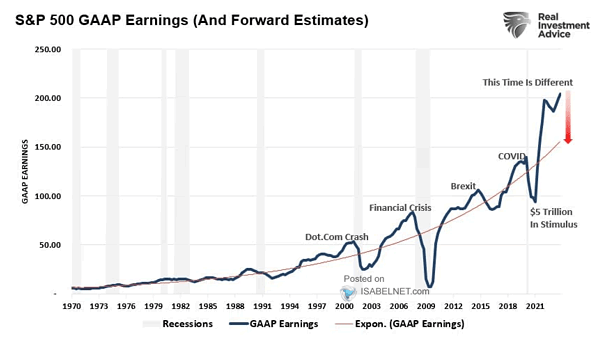
S&P 500 GAAP Earnings (and Forward Estimates) Reversion to the mean is a powerful force. Should U.S. equity investors expect earnings to fall significantly? Image: Real Investment Advice
S&P 500 GAAP Earnings (and Forward Estimates) Reversion to the mean is a powerful force. Should U.S. equity investors expect earnings to fall significantly? Image: Real Investment Advice
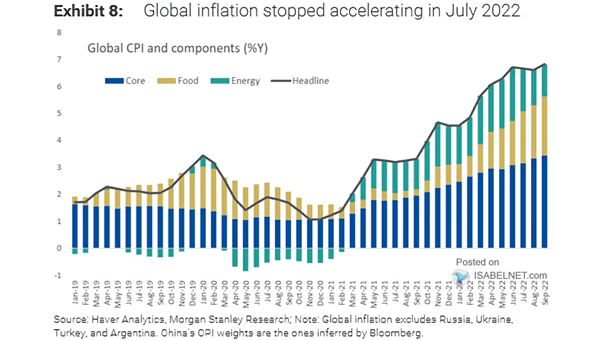
Inflation – Global CPI and Components Is global inflation close to peaking? Image: Morgan Stanley Research
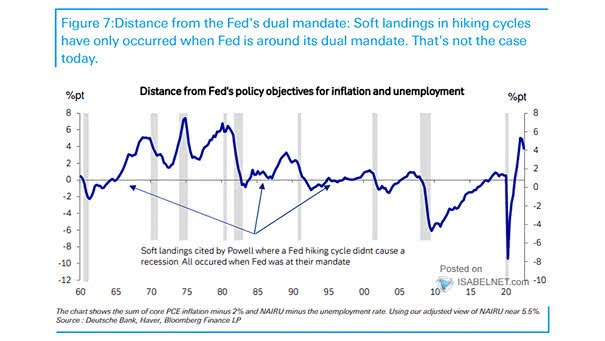
Distance from Fed’s Policy Objectives for Inflation and Unemployment Is the U.S. economy headed for a hard landing? Image: Deutsche Bank
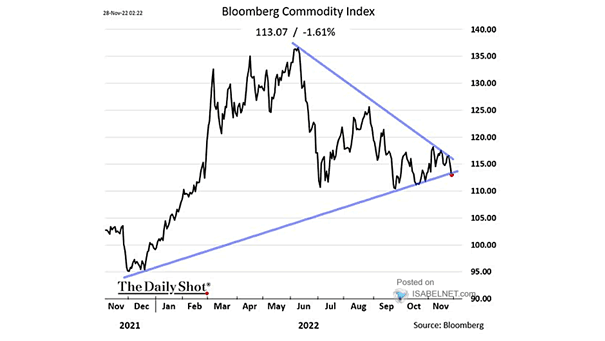
Commodities – Bloomberg Commodity Index Will commodity prices continue to fall along with inflation? Image: The Daily Shot
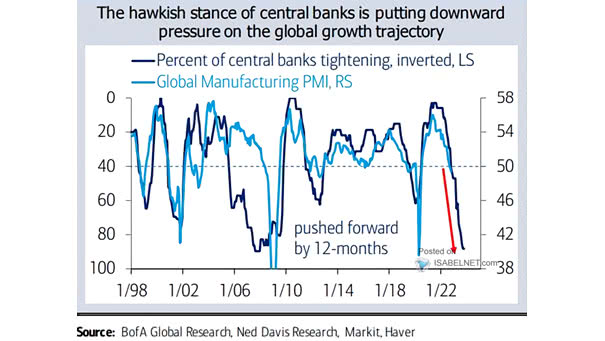
Percent of Central Banks Tightening vs. Global Manufacturing PMI Global policy tightening is putting downward pressure on global growth. Image: BofA Global Research
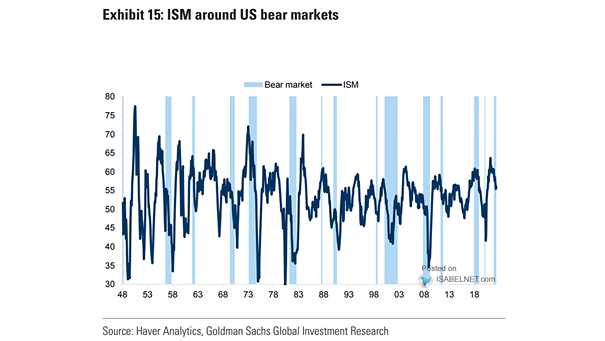
ISM Around Bear Markets The ISM tends to reach 40-44 in cyclical bear markets. Image: Goldman Sachs Global Investment Research
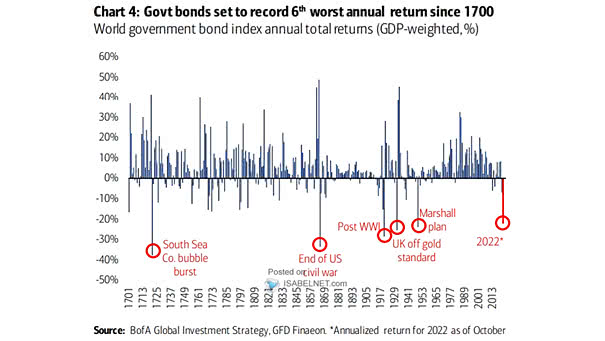
World Government Bond GDP-Weighted Return Index Global government bond markets are on course for the worst year since the Marshall Plan in 1949. Image: BofA Global Investment Strategy
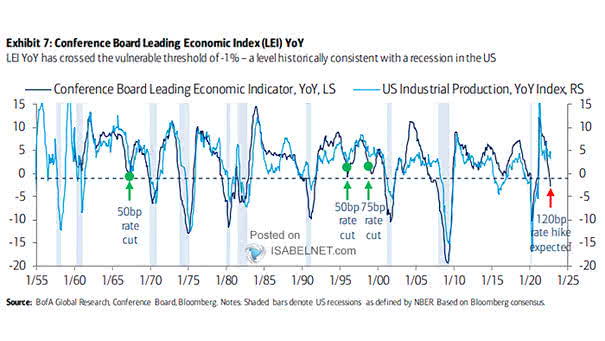
Recession – Conference Board Leading Economic Index vs. U.S. Industrial Production The Conference Board Leading Economic Index suggests a contraction in U.S. industrial production. Image: BofA Global Research
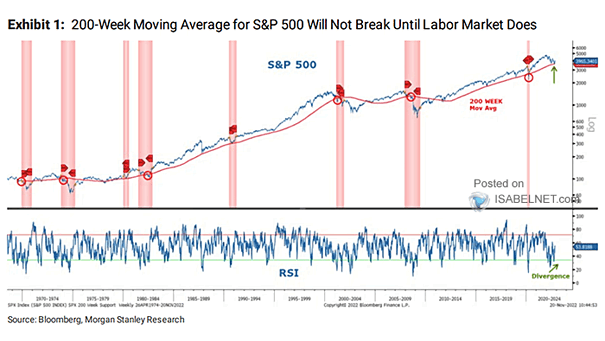
S&P 500 and 200-Week Moving Average Historically, the 200-week moving average tends to be a strong support level for the S&P 500 until a recession occurs in the United States. Image: Morgan Stanley Research
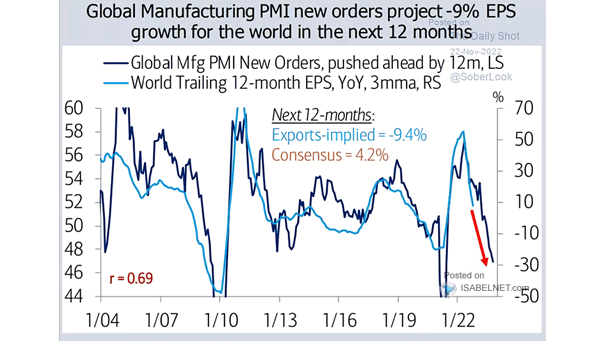
Earnings – Global Manufacturing PMI New Orders vs. World Trailing 12-Month EPS (Leading Indicator) Global manufacturing PMI new orders tend to lead world EPS growth by 12 months. Image: BofA Global Research
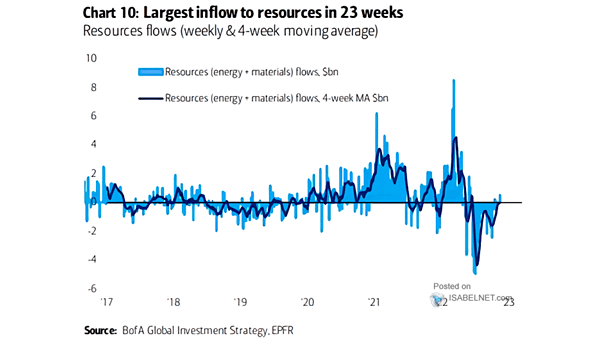
Resources (Energy + Materials) Flows Will resources (energy + materials) continue to experience inflows? Image: BofA Global Investment Strategy