Fed vs. ECB Balance Sheet
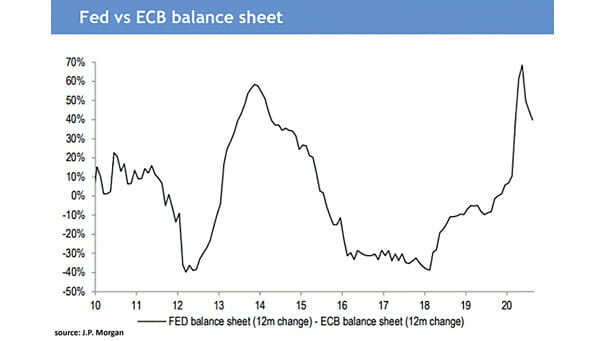
Fed vs. ECB Balance Sheet This chart puts the Fed vs. ECB balance sheet into perspective. Image: J.P. Morgan
Fed vs. ECB Balance Sheet This chart puts the Fed vs. ECB balance sheet into perspective. Image: J.P. Morgan
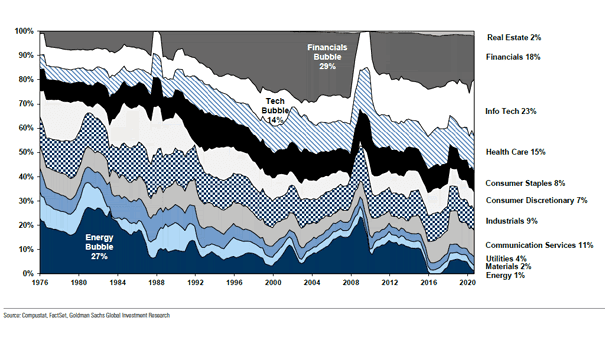
Net Income Contribution by Sector to S&P 500 This chart shows the net income contribution by sector to the S&P 500 over time. Image: Goldman Sachs Global Investment Research
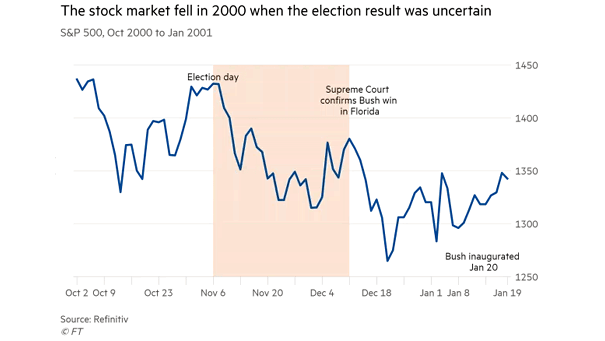
U.S. Election and S&P 500 from October 2000 to January 2001 What could happen to the stock market if there’s no clear winner on presidential Election Day? Image: Financial Times
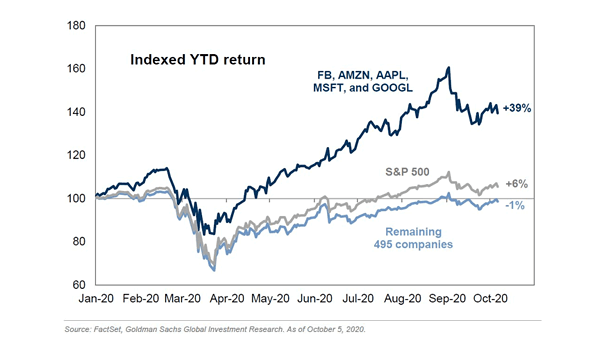
Five Largest Stocks vs. S&P 500 The five largest stocks have returned +39% YTD, while the remaining 495 stocks have returned -1%. Image: Goldman Sachs Global Investment Research
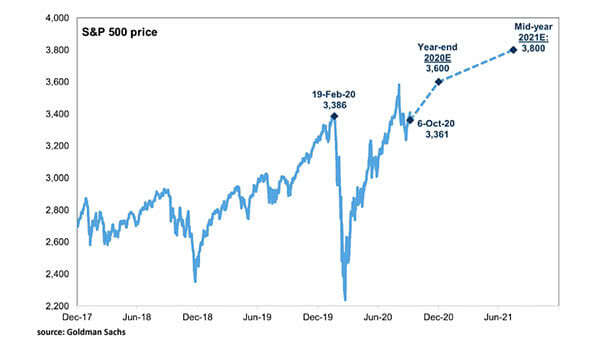
Path of the S&P 500 by the End of 2020 and Mid-Year 2021 Goldman Sachs maintains its S&P 500 price target to 3600 by the end of 2020, and its S&P 500 price target to 3800 by mid-year 2021. Image: Goldman Sachs Global Investment Research
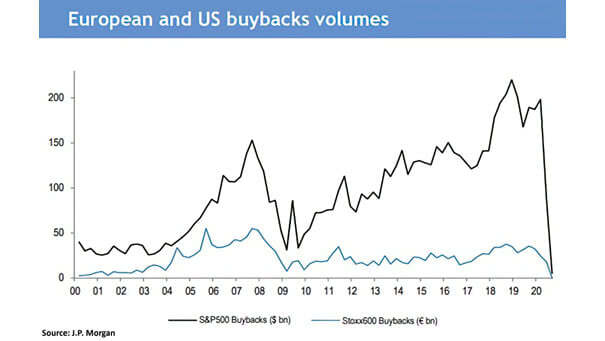
European and U.S. Buybacks Volumes Bye-bye buybacks! Buyback volumes have fallen sharply this year. Image: J.P. Morgan
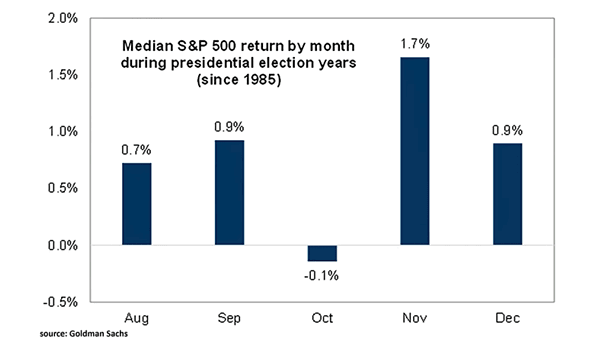
Median S&P 500 Return by Month during Presidential Election Years Can investors expect a year-end rally this year? Image: Goldman Sachs Global Investment Research
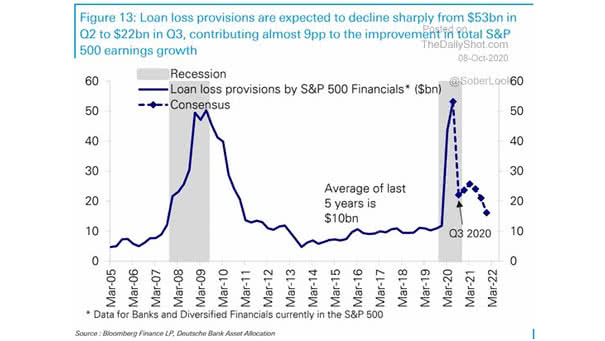
Loan Loss Provisions by S&P 500 Financials Should investors love bank stocks, as loan loss provisions are expected to decline sharply? Image: Deutsche Bank Asset Alloation
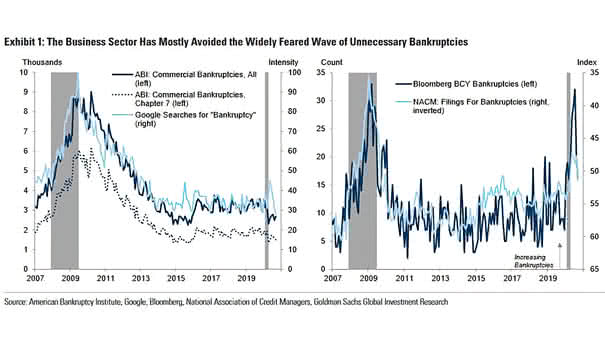
Coronavirus Crisis and Bankruptcies U.S. business bankruptcies are declining significantly. Image: Goldman Sachs Global Investment Research
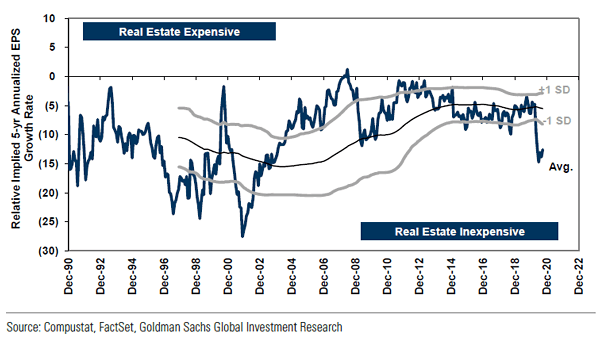
Valuation – S&P 500 Real Estate Sector Real estate appears to be very undervalued. Image: Goldman Sachs Global Investment Research
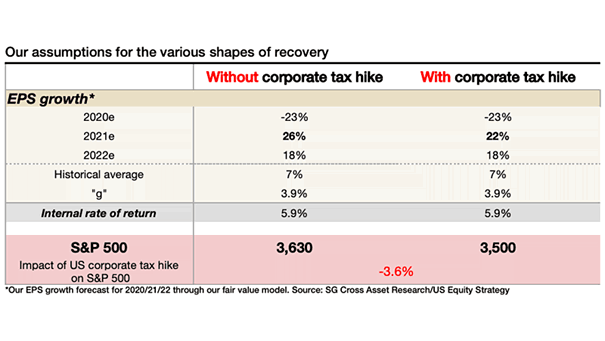
Impact of U.S. Corporate Tax Hike on S&P 500 This table suggests the impact on the S&P 500 if Joe Biden won the election and the Democrats swept both houses of Congress. Image: Societe Generale Cross Asset Research