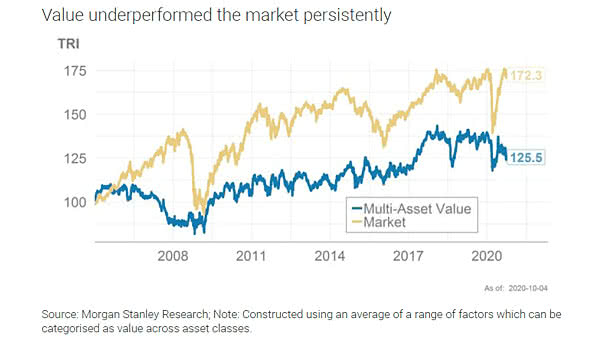
Market vs. Multi-Asset Value
Market vs. Multi-Asset Value Chart showing the painful decade for value. Has value lost its mojo? Image: Morgan Stanley Research
Market vs. Multi-Asset Value Chart showing the painful decade for value. Has value lost its mojo? Image: Morgan Stanley Research
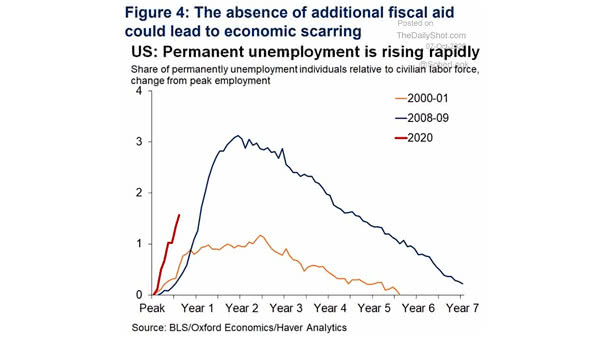
U.S. Permanent Unemployment More layoffs become permanent as the coronavirus persists. Image: Oxford Economics
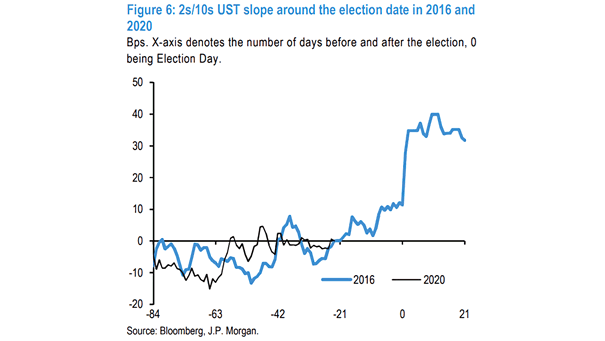
Yield Curve – 2s-10s U.S. Treasury Slope Around the U.S. Election Date in 2016 and 2020 The U.S. Treasury yield curve could steepen following the presidential election. Image: J.P. Morgan
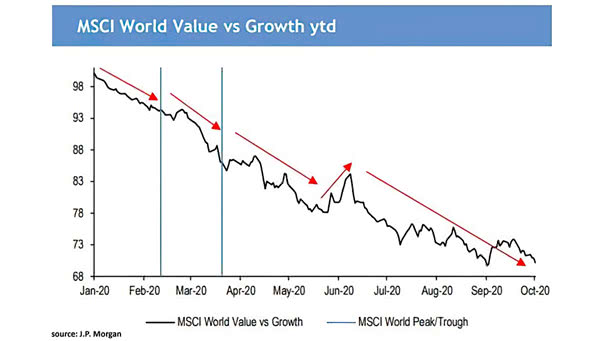
MSCI World Value vs. Growth YTD Will global value stocks continue to underperform global growth stocks, as the global economy rebounds? Image: J.P. Morgan
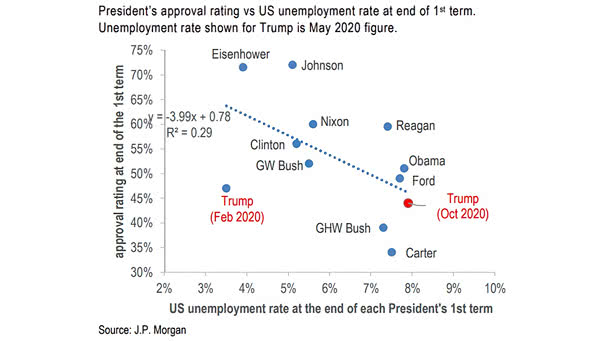
U.S. Election – President’s Approval Rating vs. U.S. Unemployment Rate at the End of First Term President Donald Trump’s approval rating is in line with the U.S. unemployment rate. Image: J.P. Morgan
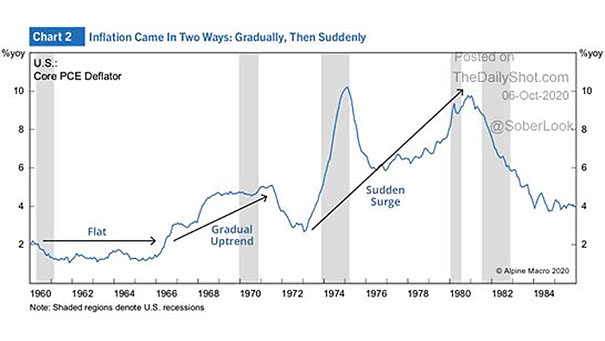
Inflation – U.S. Core PCE Deflator This chart could suggest more inflation ahead. Image: Alpine Macro
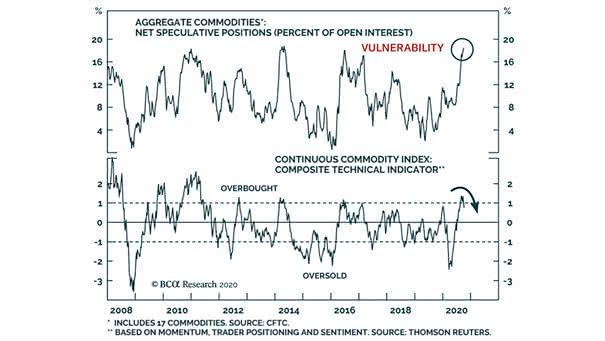
Aggregate Commodities – Net Speculative Positions Net speculative positions could suggest a correction in commodities. Image: BCA Research
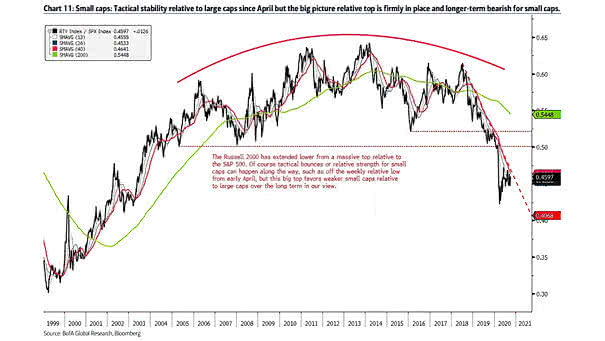
Small-Cap Stocks – Russell 2000 Relative to the S&P 500 Chart suggesting weaker small caps relative to large caps over the long term. Image: BofA Global Research
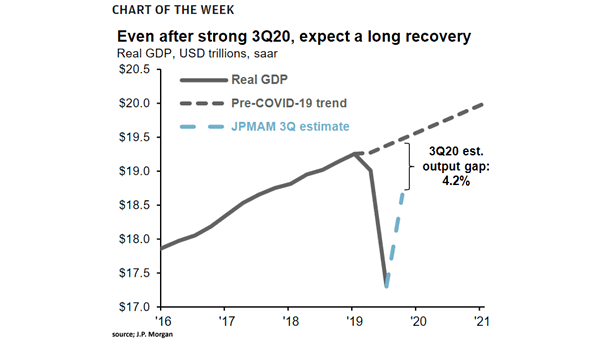
U.S. Real GDP vs. Pre-COVID-19 Trend Investors should not expect a quick recovery. Image: J.P. Morgan Asset Management
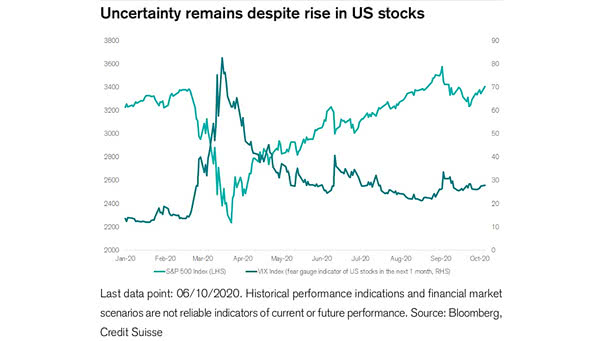
VIX Index and S&P 500 Index VIX remains at high levels, despite the market rally. More volatility ahead? Image: Creduit Suisse
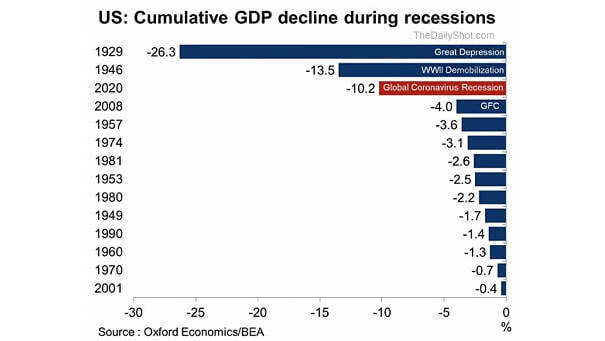
Cumulative GDP Decline During Recessions in the U.S. The cumulative decline in U.S. GDP is -10.2%. This is one of the deepest recession on record. Image: Oxford Economics