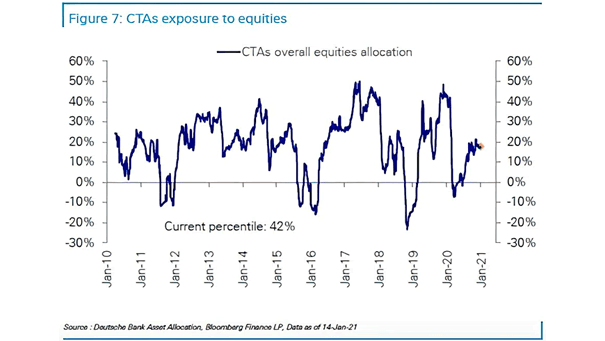
CTAs Exposure to the U.S. Dollar
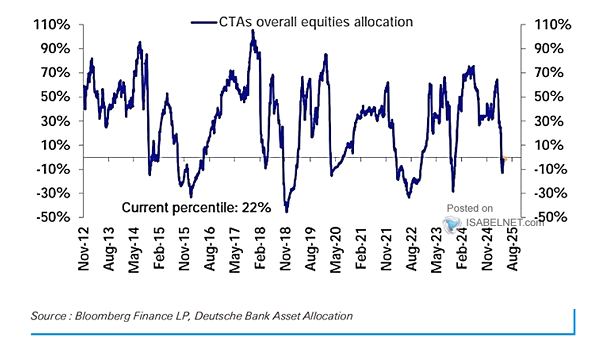
CTAs Exposure to the U.S. Dollar After betting against the U.S. dollar, Commodity Trading Advisors are easing up on their shorts and edging toward neutral. Few will be surprised as the greenback finds support when the world gets nervous. Image: Deutsche Bank Asset Allocation