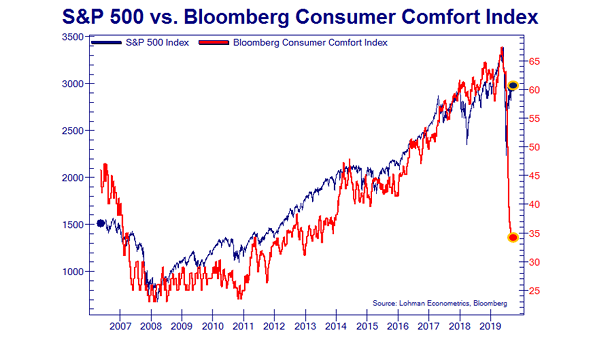
S&P 500 vs. Bloomberg Consumer Comfort Index
S&P 500 vs. Bloomberg Consumer Comfort Index This chart highlights the wide divergence between the S&P 500 and the growing anxiety among Americans on the condition of the U.S. economy, their personal finances and the buying climate. Image: Lohman Econometrics