Sentiment – CBOE Put/Call Ratio and S&P 500 Index
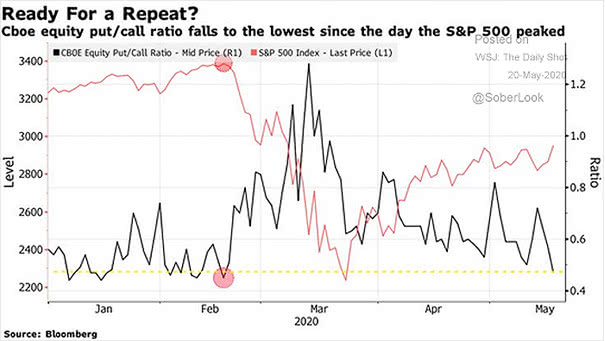
Sentiment – CBOE Put/Call Ratio and S&P 500 Index The put/call ratio suggests that investors are complacent. Image: Bloomberg
Sentiment – CBOE Put/Call Ratio and S&P 500 Index The put/call ratio suggests that investors are complacent. Image: Bloomberg
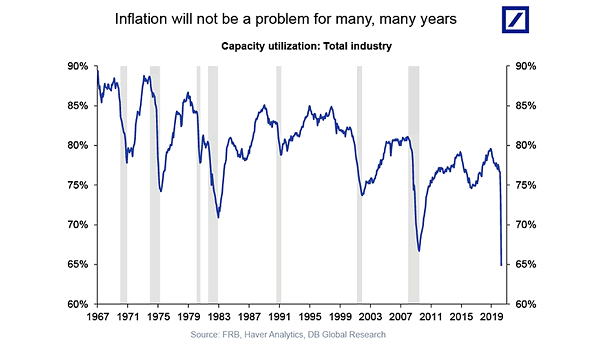
Inflation and Capacity Utilization This chart suggests that inflation will not be a problem for many years, as economists watch capacity utilization indicators for signs of inflation pressures. Image: Deutsche Bank Global Research
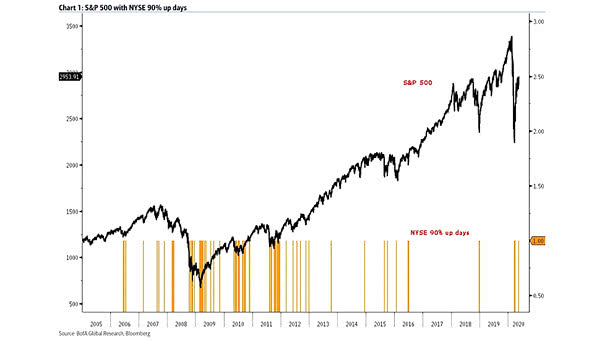
S&P 500 with NYSE 90% Up Days Historically, S&P 500 returns after an NYSE 90% up day are positive 80% of the time after 20 days. Image: BofA Global Research
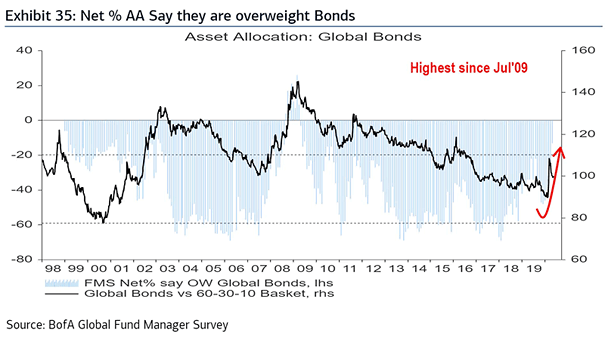
Asset Allocation: Global Bonds FMS investors are still more bearish than bullish. Image: BofA Global Fund Manager Survey
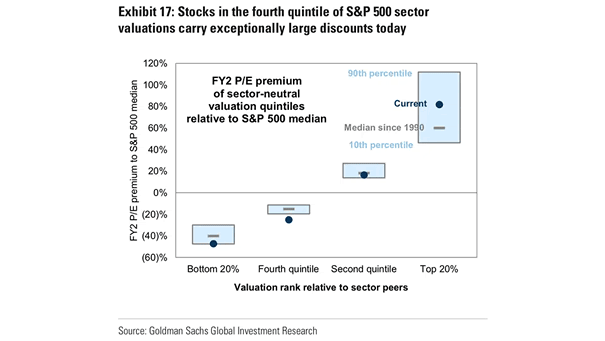
FY2 P/E Premium of Sector-Neutral Valuation Quintiles Relative to S&P 500 Median This chart shows S&P 500 sector valuations compared with their historical distribution since 1990. Image: Goldman Sachs Global Investment Research
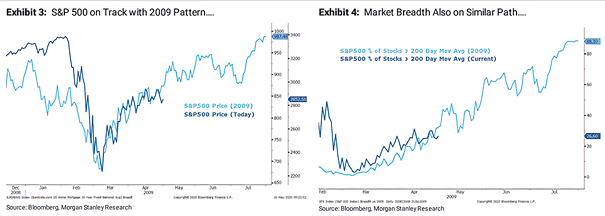
S&P 500 – 2020 vs. 2009 This chart suggests that the S&P 500 is following the 2009 pattern and market breadth. Image: Morgan Stanley Research
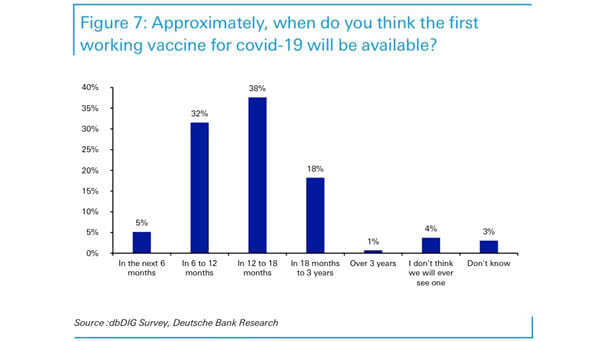
Coronavirus Survey: When Do You Think the First Working Vaccine for COVID-19 Will Be Available? A majority market professionals think that the first working vaccine for COVID-19 will be available within 6-18 months. Image: Deutsche Bank Research
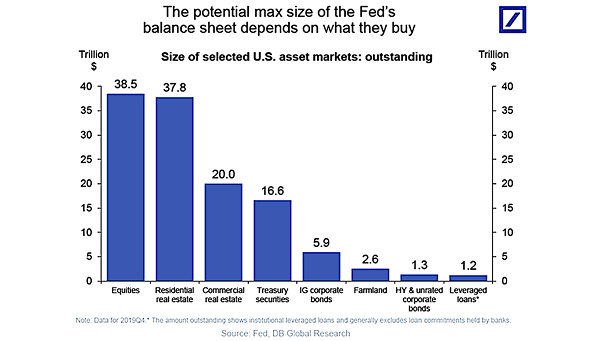
Size of Selected U.S. Asset Markets This chart puts into perspective the size of selected U.S. asset markets. The U.S. stock market is more than twice as large as the U.S. Treasury market. Image: Deutsche Bank Global Research
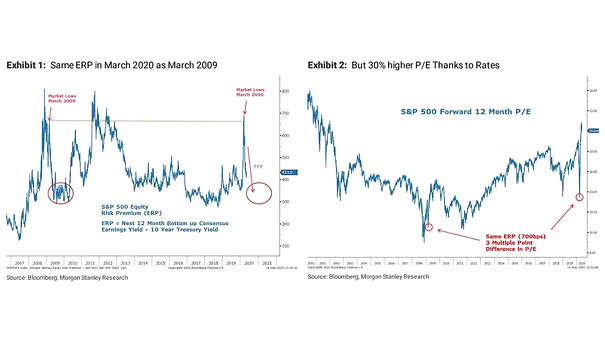
S&P 500 Equity Risk Premium – 2020 vs. 2009 Same equity risk premium in March 2020 as March 2009, but 30% higher P/E thanks to the level of rates. Image: Morgan Stanley Research
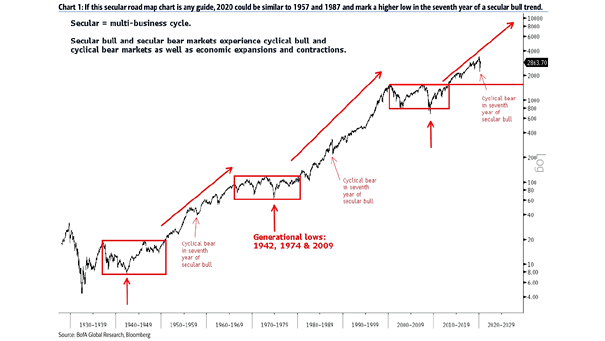
S&P 500 – The 1980 – 2000 Secular Bull Market Versus The Current One The S&P 500 has been climbing for years, but longevity alone does not signal the finish. The prior secular bull market lasted nearly two decades. If history rhymes, this one may still have room to run. Image: Carson Investment Research
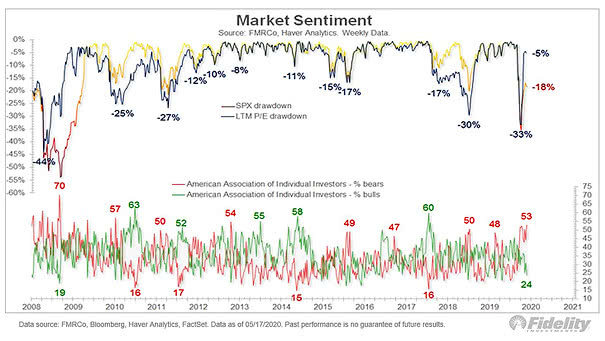
Market Sentiment (AAII) Are AAII investors too bearish? The S&P 500 is up 30%, but there are now more bears than at the March lows. Image: Fidelity Investments