U.S. Unemployment Rate and Corporate Bankruptcies
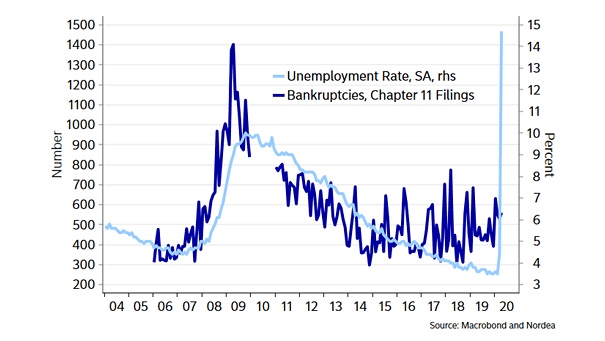
U.S. Unemployment Rate and Corporate Bankruptcies A scary chart? Corporate bankruptcies could begin to rise, if the US economy doesn’t rebound soon. Image: Nordea and Macrobond
U.S. Unemployment Rate and Corporate Bankruptcies A scary chart? Corporate bankruptcies could begin to rise, if the US economy doesn’t rebound soon. Image: Nordea and Macrobond
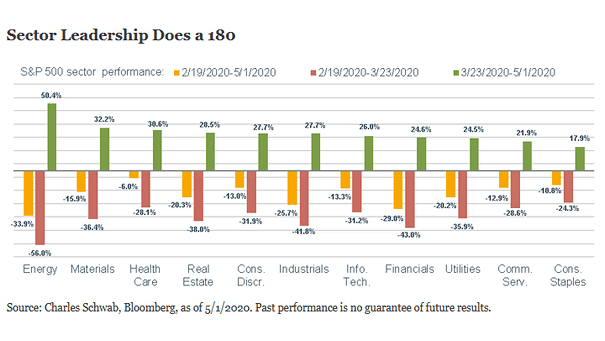
S&P 500 Sector Performance Since the March 23 Low Since the March 23 low, the best-performing sector has been energy, not tech. Image: Charles Schwab
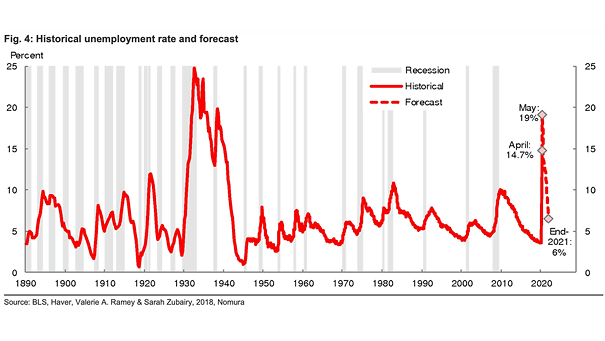
Historical U.S. Unemployment Rate and Forecast Nomura forecasts an unemployment rate of 6% in the United States by the end of 2021. Image: Nomura
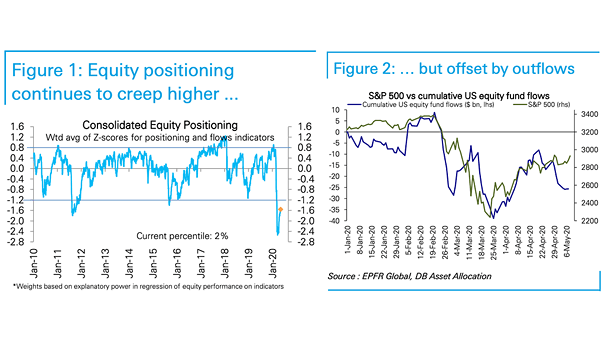
Consolidated Equity Positioning and S&P 500 vs. Cumulative U.S. Equity Fund Flows Equity positioning continues to creep higher, but flows remain very defensive, as equities have seen outflows for the last three weeks. Image: Deutsche Bank Asset Allocation
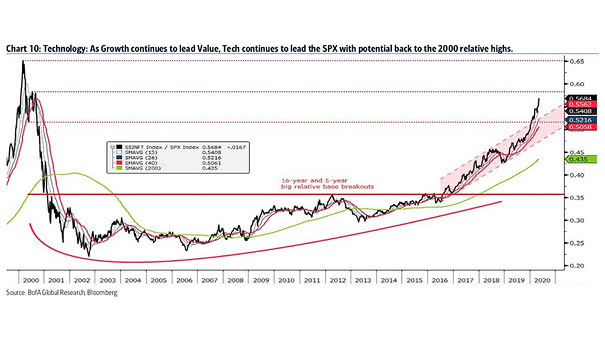
Technology Relative to the S&P 500 This chart suggests that technology is positioned to test its tech bubble highs from 2000. Image: BofA Global Research
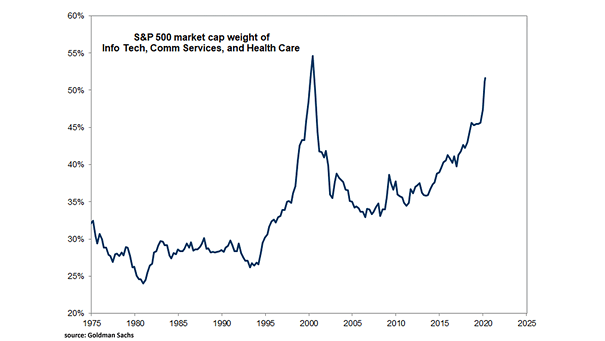
S&P 500 Market Capitalization Weight of Info Tech, Communication Services, and Health Care Info tech, communication services, and health care sectors now account for 52% of the S&P 500 market capitalization. Image: Goldman Sachs Global Investment Research
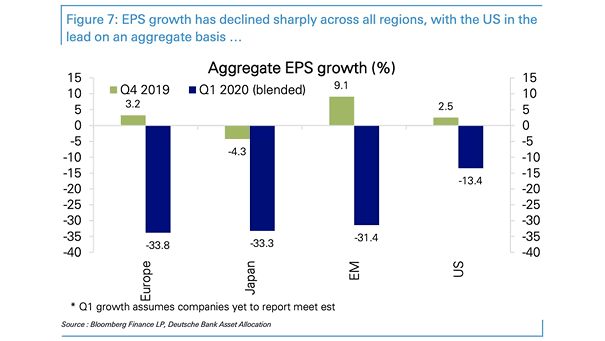
Aggregate EPS Growth U.S. earnings are outperforming the rest of the world in Q1:2020, because the U.S. was the slowest to lock down its economy. Image: Deutsche Bank Asset Allocation
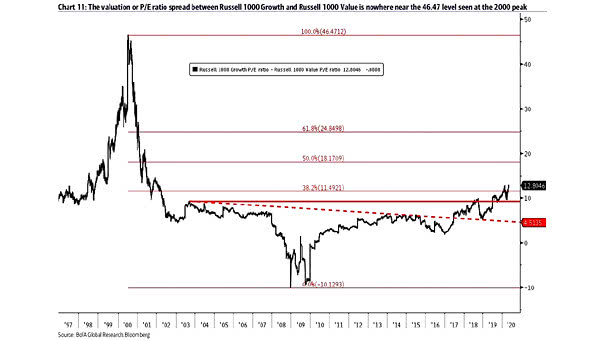
Valuation – P/E Ratio Spread Between Russell 1000 Growth and Russell 1000 Value The P/E valuation spread for Growth vs. Value at 12.88 is nowhere near the 46.47 level seen at the 2000 peak and suggests that Growth should continue to beat value. Image: BofA Global Research
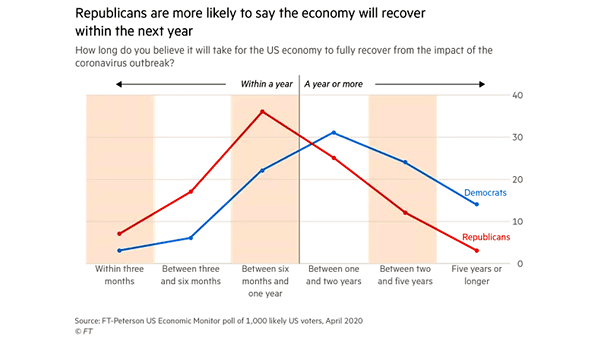
Recovery of the U.S. Economy – Republicans vs. Democrats Republicans and Democrats have different views on the recovery of the U.S. economy. Republicans are eager to reopen economy, while Democrats are more cautious. Image: Financial Times
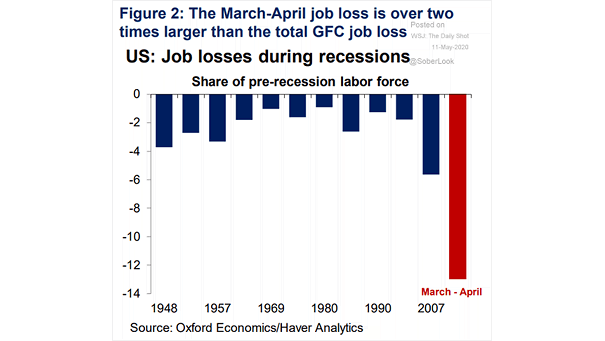
U.S. Job Losses During Recessions The U.S. jobs report for April brings sobering news. Image: Oxford Economics
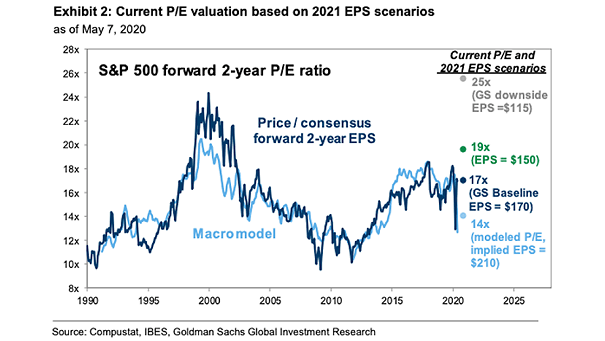
S&P 500 Current P/E Valuation Based on 2021 EPS Scenarios Goldman Sachs baseline forecast for S&P 500 earnings in 2021 is $170, and the downside forecast is $115. Today, the S&P 500 trades at 19.5x the buy-side estimate of EPS. Image: Goldman Sachs Global Investment Research