U.S. Recessions vs. U.S. GDP Growth
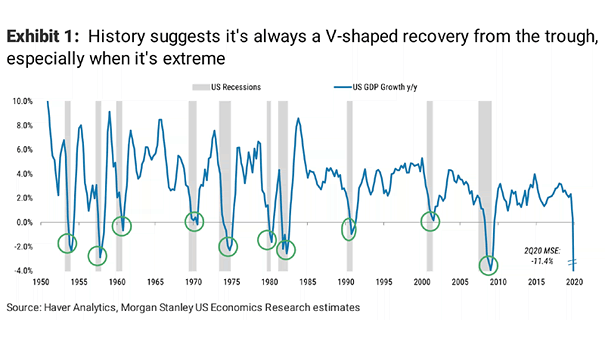
U.S. Recessions vs. U.S. GDP Growth If history is any guide, this chart suggests a V-shaped recovery. Image: Morgan Stanley Research
U.S. Recessions vs. U.S. GDP Growth If history is any guide, this chart suggests a V-shaped recovery. Image: Morgan Stanley Research
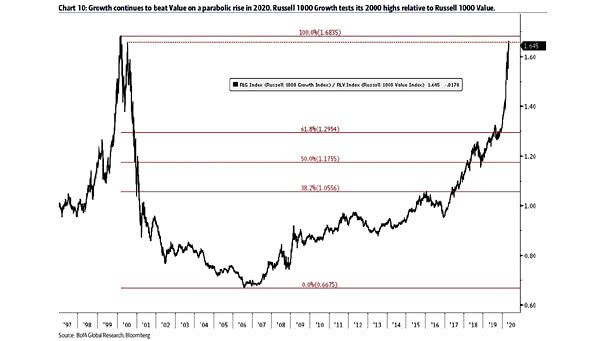
Russell 1000 Growth vs. Russell 1000 Value BofA suggests that the relative strength for Growth could continue, as the P/E valuation spread for Growth vs Value at 12.88 is nowhere near the 46.47 level seen at the 2000 peak. Image: BofA Global Research
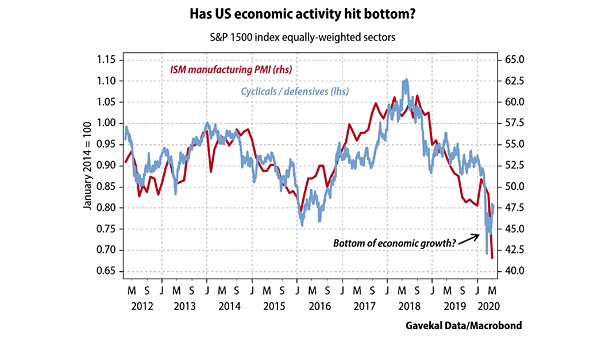
ISM Manufacturing PMI vs. Cyclicals/Defensives The outperformance of U.S. cyclicals could suggest that the U.S. economic activity has bottomed. Image: Gavekal, Macrobond
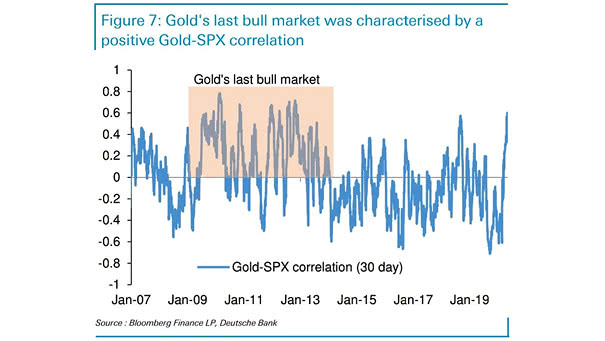
Gold’s Last Bull Market and Gold/S&P 500 Correlation During the GFC, the correlation between gold and the S&P 500 was positive. Deutsche Bank suggests that gold could move higher, as investor confidence remains subdued. Image: Deutsche Bank
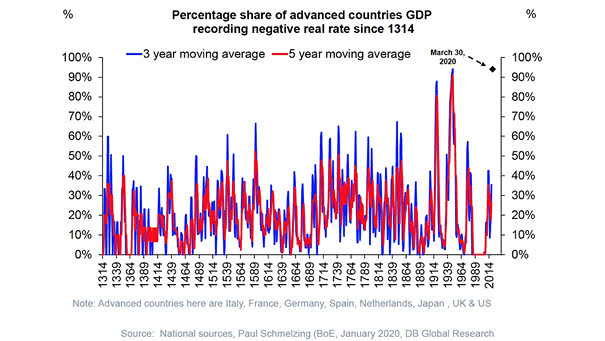
Percentage Share of Advanced Countries GDP Recording Negative Real Interest Rate Since 1314 This chart shows the record high level of advanced countries GDP experiencing negative real interest rates. Image: Deutsche Bank Global Research
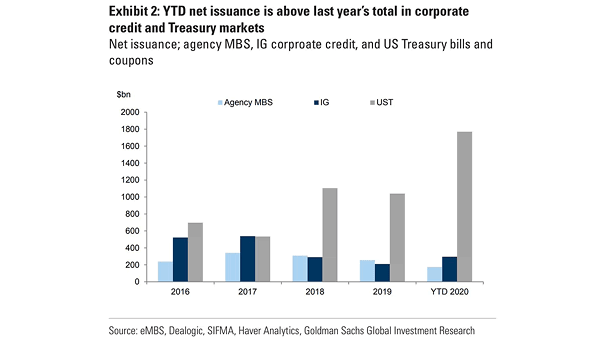
Net Issuance – Agency MBS, IG Corporate Credit, and U.S. Treasury Bills and Coupons March and April saw record paces of IG issuance. YTD total of net supply in IG is above last year’s number. Image: Goldman Sachs Global Investment Research
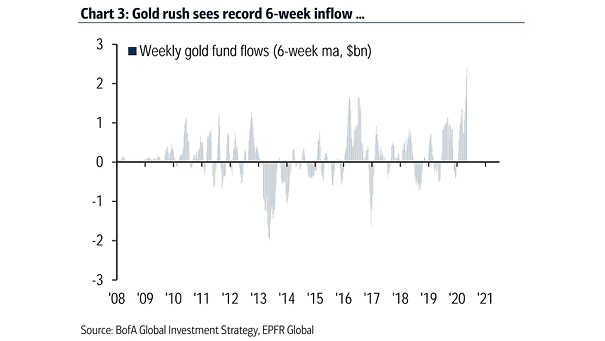
Weekly Gold Fund Flows Gold funds saw a significant net increase in holding, as investors sought a defensive position after a month of volatility. Image: BofA Global Investment Strategy
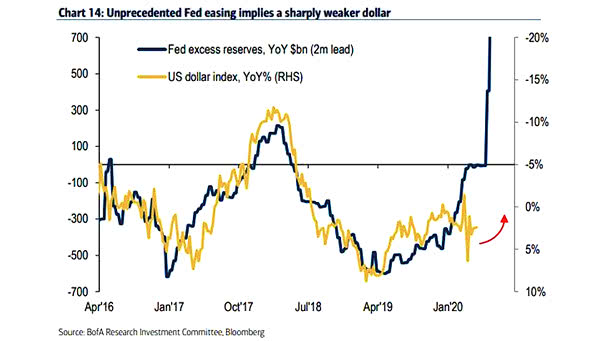
U.S. Dollar Index and Fed Excess Reserves Fed excess reserves suggest lower U.S. dollar ahead. Image: BofA Research Investment Committee
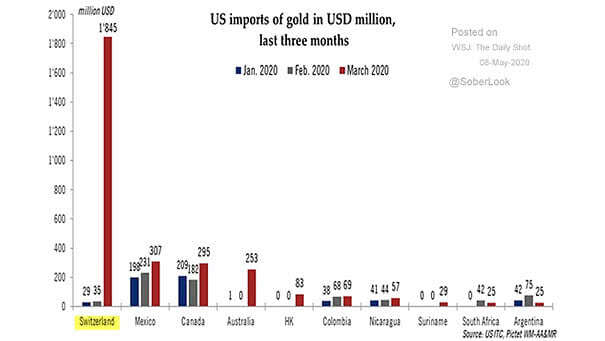
U.S. Imports of Gold U.S. imports of gold increased significantly in March 2020, amid fears of shortages. Image: Pictet Wealth Management
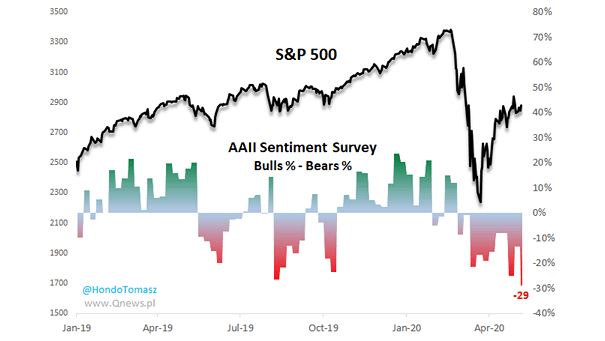
S&P 500 vs. AAII Sentiment Survey AAII survey is more bearish than in March, as U.S. individual investors remain pessimistic about the rally. Image: Hondo Tomasz

Nasdaq vs. S&P 500 and Dow Jones The Nasdaq Composite is back into positive territory for 2020, after the sharp sell off in March. Image: CNBC