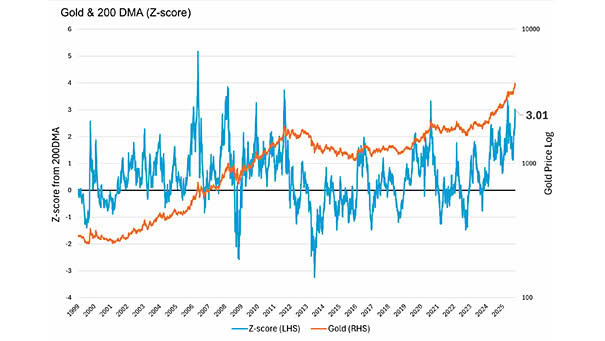
ISABELNET Cartoon of the Day

ISABELNET Cartoon of the Day Bulls are confident that the bull market in 2025 is as secure as a dog with a bone—stay ready for surprises! Have a Great Day, Everyone! 😎

1987 Market Crash – DXY Dollar Index and 10-Year UST Yield

1987 Market Crash – DXY Dollar Index and 10-Year UST Yield Bond yields rarely rise while the dollar falls, as higher yields usually boost currency appeal. This unusual trend signals waning confidence, similar to the pattern seen before the 1987 Black Monday crash. Image: Bloomberg

Equities – MSCI U.S./RoW Distance from 200-DMA

Equities – MSCI U.S./RoW Distance from 200-DMA The MSCI U.S./RoW distance from the 200-DMA highlights a major interruption to the narrative of U.S. exceptionalism and reinforces the need for global diversification in equity portfolios. Image: Bloomberg

S&P 500 and NYSE >89% Advancers and >89% Advancing Volume in Nine Days

S&P 500 and NYSE >89% Advancers and >89% Advancing Volume in Nine Days A rare event—over 89% of NYSE stocks and volume advancing twice in nine days—has historically signaled strong bullish momentum. Since 1980, the S&P 500 was positive 100% of the time over the next year, with a median 35% gain. Image: Carson Investment…

ISABELNET Cartoon of the Day

ISABELNET Cartoon of the Day Wall Street bears are convinced the bull market is crazy, but bulls are too busy wearing noise-canceling headphones to hear any warnings. Happy “Hump” Day, Everyone! 🐫🐪😎

U.S. Bitcoin ETF Flows

U.S. Bitcoin ETF Flows U.S. Bitcoin ETFs have experienced strong inflows. Bitcoin has rebounded over 20% from its early April low, surpassing $90,000. During this period, Bitcoin has significantly outperformed U.S. equities. Image: Bloomberg

Dow Jones Industrial Average vs. Smart Money Flow Index

Dow Jones Industrial Average vs. Smart Money Flow Index The Smart Money Flow Index currently suggests that the most probable short-term direction for the U.S. stock market is upward. Image: Paulsen Perspectives

S&P 500 Valuations

S&P 500 Valuations The composite S&P 500 valuation indicator—which integrates PE ratios, equity risk premia, and price-based mean reversion factors—has recently reset to a level close to neutral, which is an encouraging sign. Image: Topdown Charts

ISABELNET Cartoon of the Day

ISABELNET Cartoon of the Day When bulls sense a market boom, bears are quick to dismiss it, claiming there’s “nothing to see here.” Have a Great Day, Everyone! 😎

S&P 500 Forward P/E Ratio and Subsequent 5-Year Returns

Forward P/E Ratio and Subsequent 5-Year Annualized Returns Given current U.S. stock market valuations, investors may need to lower their expectations for equity returns over the next five years. Image: J.P. Morgan Asset Management