S&P 500 and Earnings Revisions
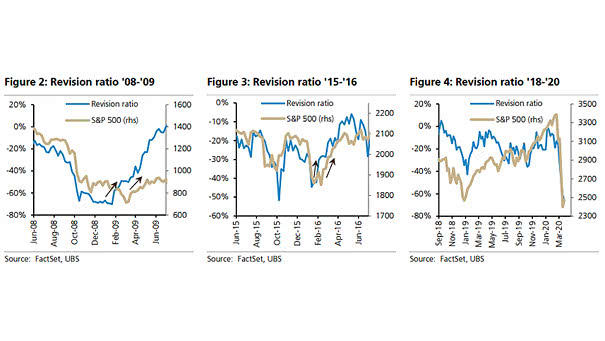
S&P 500 and Earnings Revisions In recent history, the S&P 500 has bottomed when the second derivative of earnings revisions have bottomed. Image: UBS
S&P 500 and Earnings Revisions In recent history, the S&P 500 has bottomed when the second derivative of earnings revisions have bottomed. Image: UBS
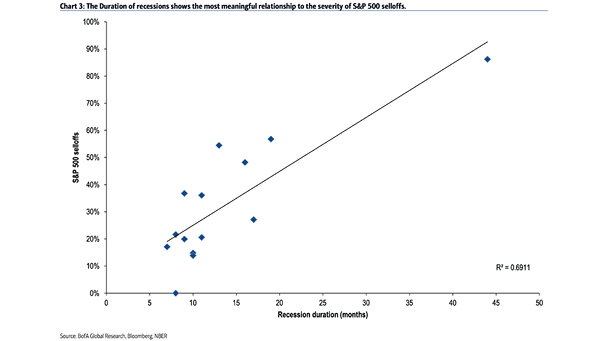
S&P 500 Selloffs and Recession Duration This chart shows the correlation between the duration of recessions and the severity of S&P 500 selloffs (R² = 0.69). Image: BofA Global Research
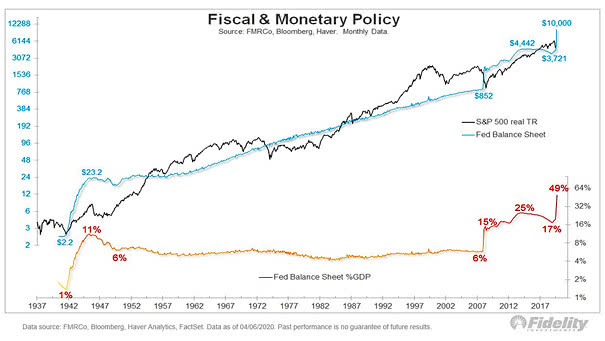
S&P 500 Real Total Return and Federal Reserve Balance Sheet As this chart illustrates, the Fed balance sheet could grow to $10 trillion, equivalent to 49% of U.S. GDP. Image: Fidelity Investments
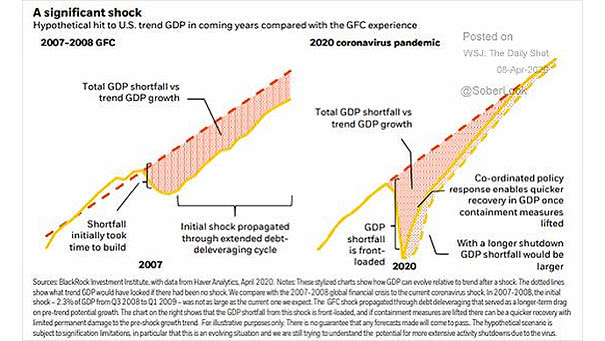
U.S. Trend GDP – 2007-2008 GFC vs. 2020 Coronavirus Pandemic This chart puts into perspective the hypothetical hit to U.S. trend GDP in coming years vs. the global financial crisis. Image: BlackRock Investment Institute
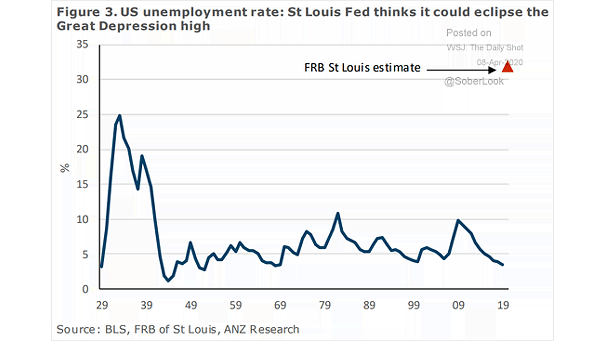
U.S. Unemployment Rate – FRB St Louis Estimate According to St Louis Fed, the US employment rate could eclipse the Great Depression high. Image: ANZ Research
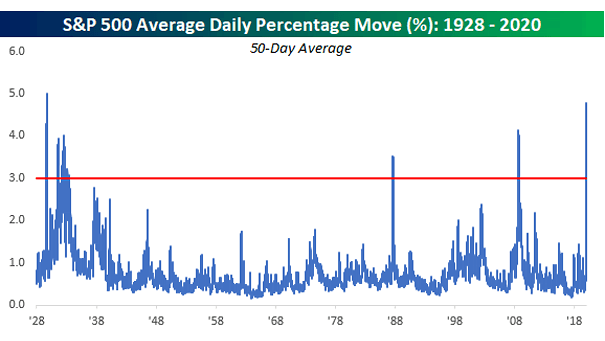
S&P 500 Average Daily Percentage Move: 1928-2020 The volatility has been unusual over the last five weeks, as the S&P 500’s average absolute daily percentage change has been +/-4.8%. Image: Bespoke Investment Group
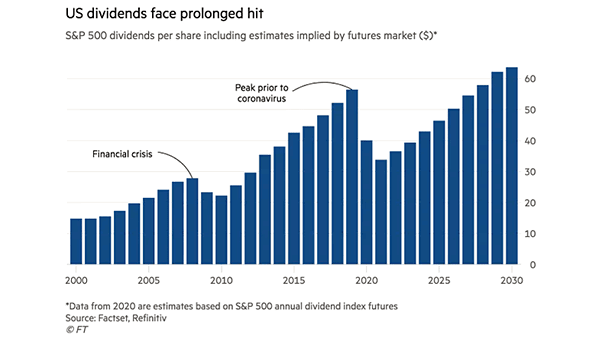
S&P 500 Dividends per Share Including Estimates Implied by Futures Market This chart suggests that dividends will take nine years to recover from the downturn caused by coronavirus. Image: Financial Times
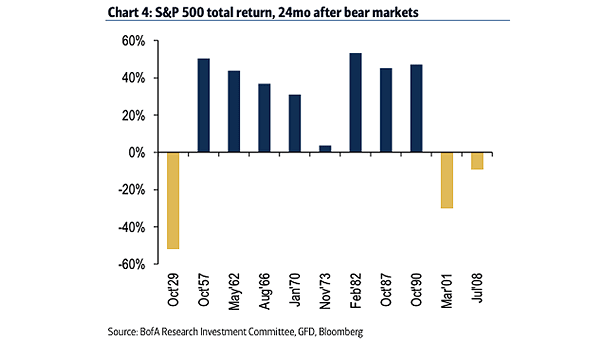
S&P 500 Total Return, 24 Months After Bear Markets This chart puts into perspective the S&P 500 Total Return, 24 months after bear markets. Image: BofA Research Investment Committee
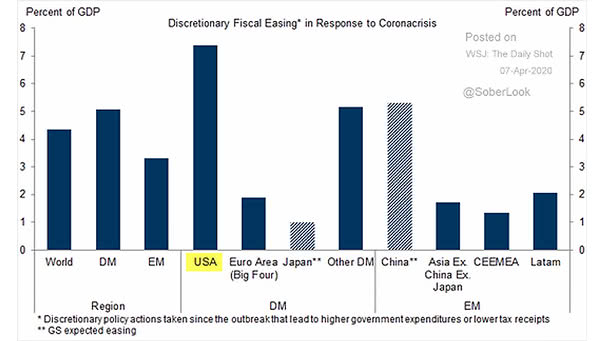
Fiscal Policy – Discretionary Fiscal Easing in Response to Coronavirus Crisis This chart puts into perspective the U.S. fiscal stimulus relative to other countries. Image: Goldman Sachs Global Investment Research
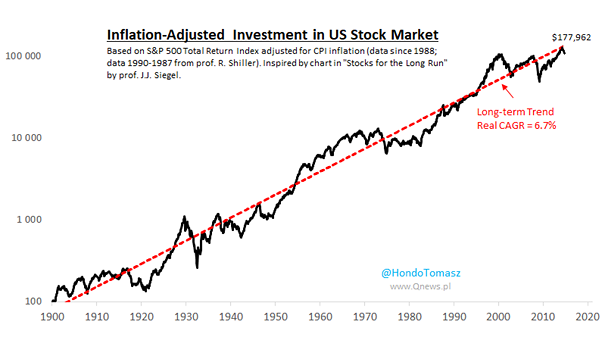
Inflation-Adjusted Investment in U.S. Stock Market This chart puts into perspective the long-term trend of the S&P 500 Total Return adjusted for CPI inflation (real CAGR = 6.7%). Image: Hondo Tomasz
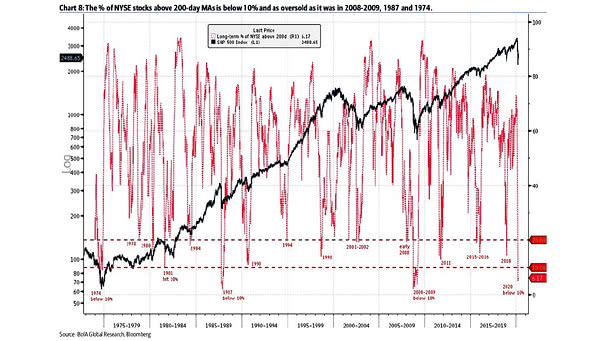
Percentage of NYSE Stocks Above 200-Day Moving Averages The percentage of NYSE stocks above 200-day MAs is below 10% and as oversold as it was in 2008-2009, 1987 and 1974. Image: BofA Global Research