S&P 500 Earnings Estimate Progression
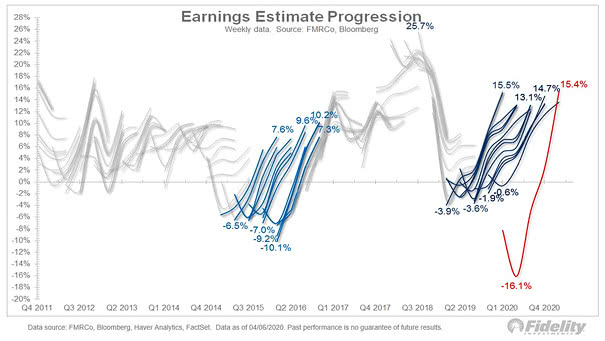
S&P 500 Earnings Estimate Progression The market doesn’t believe that the long term earnings power has changed and expects a V-shaped earnings recovery. Image: Fidelity Investments
S&P 500 Earnings Estimate Progression The market doesn’t believe that the long term earnings power has changed and expects a V-shaped earnings recovery. Image: Fidelity Investments
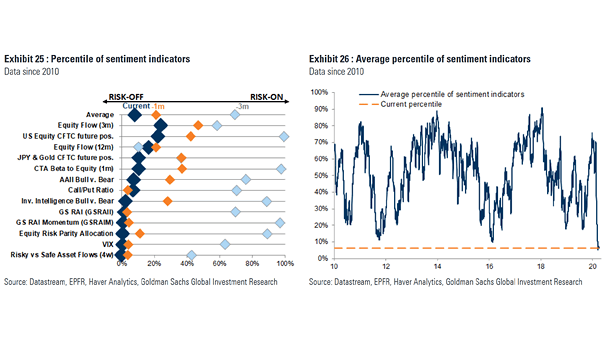
Market Sentiment Indicators Most market sentiment indicators are still at low levels. Image: Goldman Sachs Global Investment Research
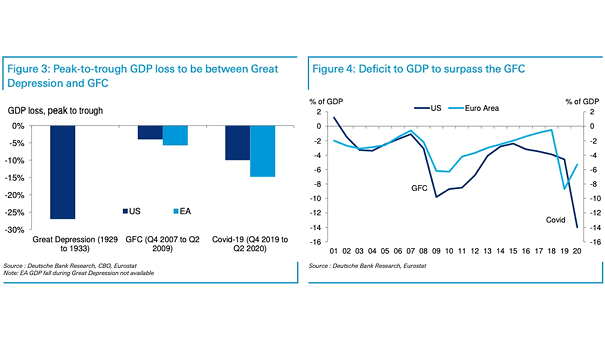
U.S. and Euro Area GDP Loss and Deficit to GDP The peak-to-trough decline in U.S. and EA GDP is expected to be more than twice as large as during the global financial crisis. Image: Deutsche Bank Research
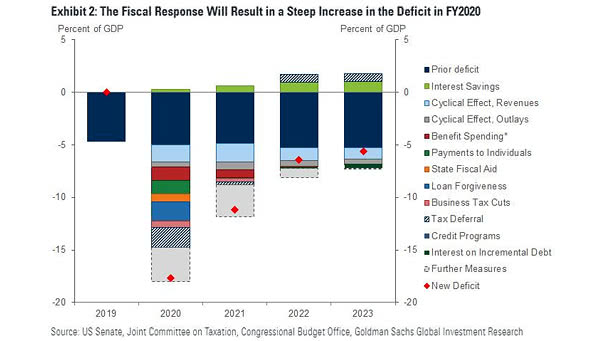
U.S. Fiscal Stimulus and Deficit This chart suggests that the fiscal stimulus will amount to 18% of GDP in 2020 and 11% next year. Image: Goldman Sachs Global Investment Research
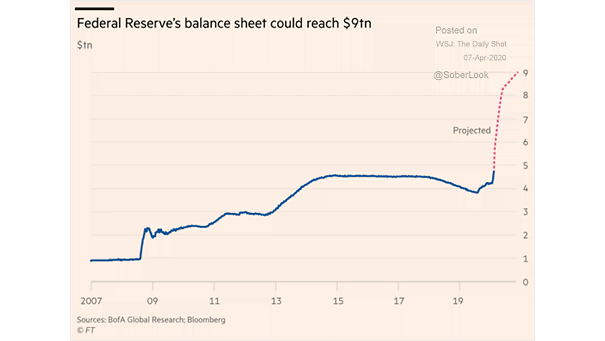
Federal Reserve’s Balance Sheet The Federal Reserve’s balance sheet could exceed US$ 9 trillion at the end of 2020, equivalent to more than 40% of US GDP. Image: Financial Times
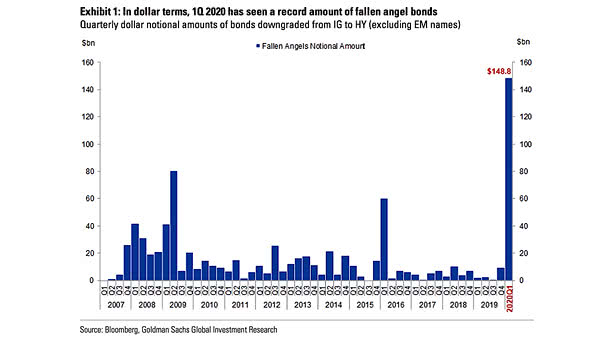
Quarterly Dollar Notional Amounts of Bonds Downgraded from IG to HY The pace of rating downgrades has accelerated markedly in recent months. Image: Goldman Sachs Global Investment Research
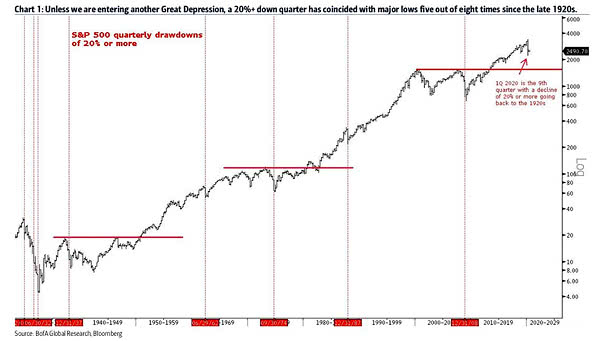
S&P 500 Quarterly Drawdowns of 20% or More Since 1928, a 20%+ down quarter has coincided with major lows five out of eight times. Image: BofA Global Research
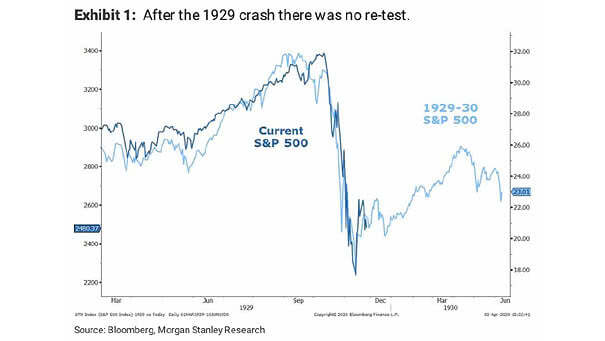
S&P 500 – 2020 vs. 1929-30 This chart suggests that the S&P 500 could find support without a full retest of the lows. Image: Morgan Stanley Research
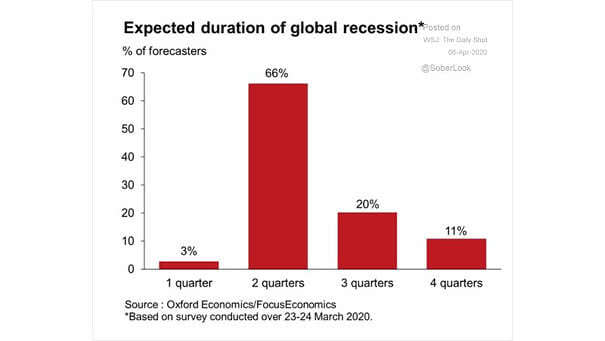
Expected Duration of Global Recession This chart suggests the expected duration of the global recession based on survey data. Image: Oxford Economics
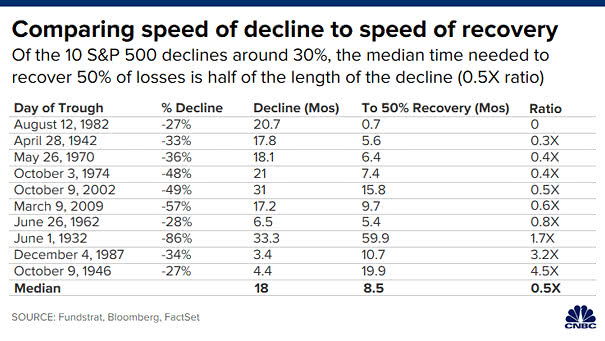
Bear Market – Comparing Speed of Decline to Speed of Recovery Of the 10 stock market drawdowns of about 30% since 1920, the median time needed to recover half of losses, was half the duration of the decline. Image: CNBC
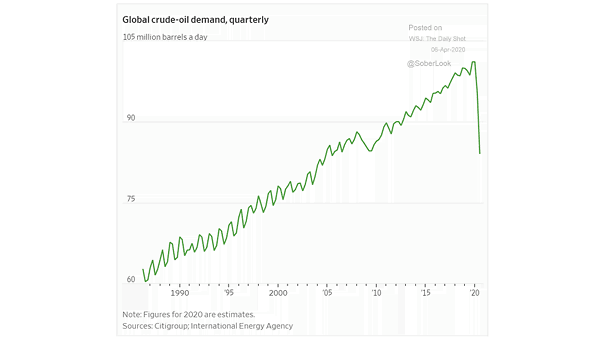
Global Crude Oil Demand Global demand for crude oil has fallen off a cliff, as the coronavirus pandemic spreads in the U.S. and around the world. Image: The Wall Street Journal