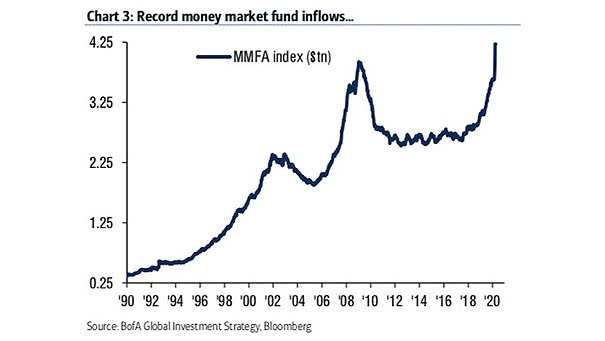
Secular Bull Market Analogs – 1949-1968 vs. S&P 500 since 2009
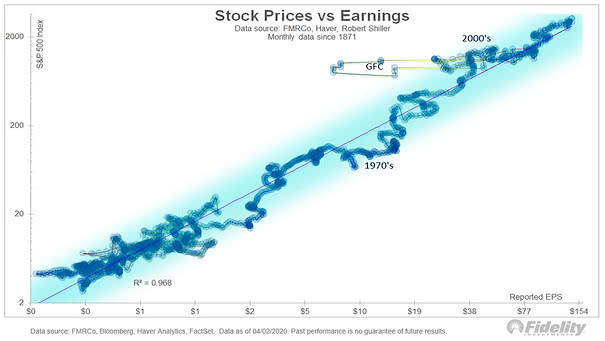
Secular Bull Market Analogs – 1949-1968 vs. S&P 500 since 2009 This chart compares the secular bull market of 1949-1968 vs. the S&P 500 since 2009. In 1962, the breadth thrust was about the same as today. Image: Fidelity Investments