S&P 500 Index Bear Market Bounces
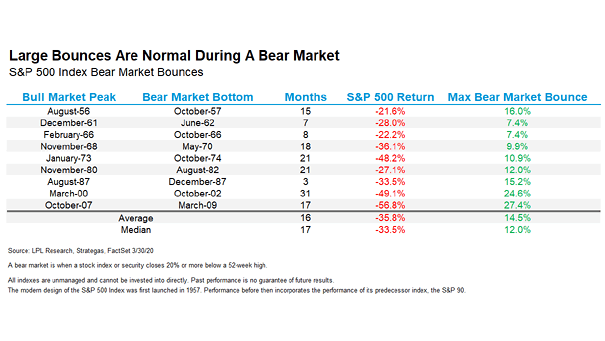
S&P 500 Index Bear Market Bounces Since 1950, the average max bounce during 9 bear markets has been +14.5%. Image: LPL Research
S&P 500 Index Bear Market Bounces Since 1950, the average max bounce during 9 bear markets has been +14.5%. Image: LPL Research
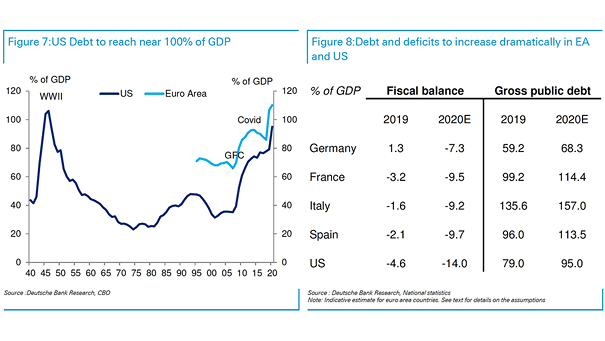
Debt and Deficits in Euro Area and U.S. Debt and deficits in the euro area and in the United States are expected to increase significantly. Image: Deutsche Bank Research

Real Yield on U.S. Corporate Bond IG & HY vs. Equity Earnings Yield Real yields on U.S. corporate bonds (IG & HY) exceed equity earnings yield Image: Gavekal, Macrobond
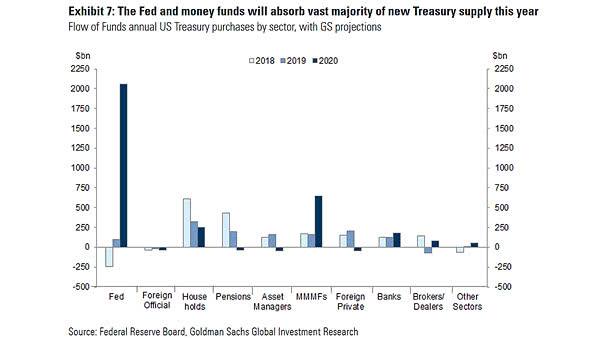
Flow of Funds Annual U.S. Treasury Purchases by Sector Money market mutual funds and the Fed will buy the vast majority of new Treasury supply in 2020. Image: Goldman Sachs Global Investment Research
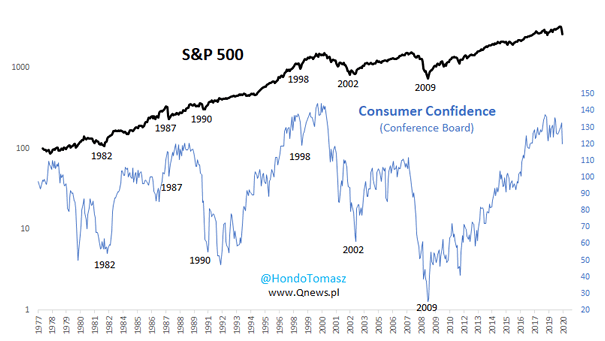
U.S. Conference Board Consumer Confidence Index vs. S&P 500 The U.S. Conference Board Consumer Confidence Index is still high compared to previous bear market bottoms. Image: Tomasz Hońdo
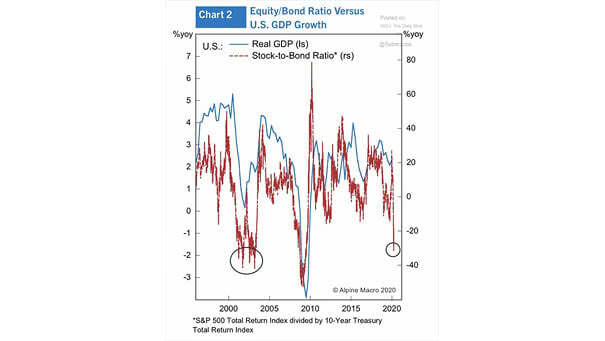
U.S. Real GDP vs. Stock-to-Bond Ratio and Recession This chart shows the correlation between US real GDP and the stock-to-bond ratio, and suggests a recession in the United States. Image: Alpine Macro
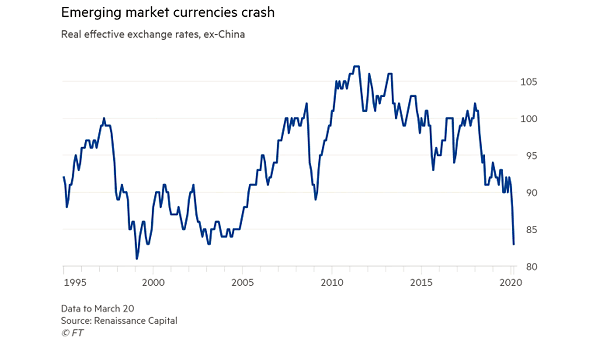
Emerging Market Currencies Crash Emerging market currencies have been pummeled by the coronavirus pandemic and the oil crisis. Image: Financial Times

U.S. GDP – Largest Annual Economic Contractions in the U.S. Since 1900 Deutsche Bank predicts U.S. GDP to shrink -4.2% in 2020. Image: Deutsche Bank
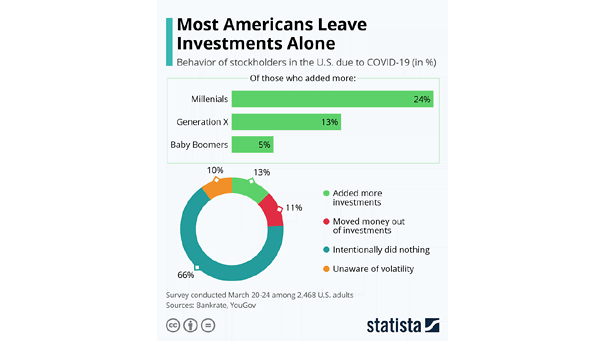
Behavior of Stockholders in the U.S. due to the Coronavirus As the chart shows, most Americans leave investments alone. Image: Statista
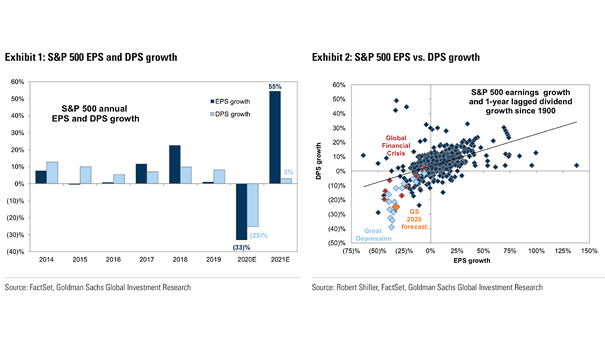
S&P 500 Earnings and Dividend Growth (S&P 500 EPS and DPS) This chart suggests estimates for earnings and dividend growth this year, highlighting the financial crisis and the Great Depression. Image: Goldman Sachs Global Investment Research

S&P 500 – Anatomy of a Decline Is this a new bull market? Not yet, although the S&P500 has gained 20% from the low of 2192. Image: Fidelity Investments