A Long-Term History of Debt & Deficits
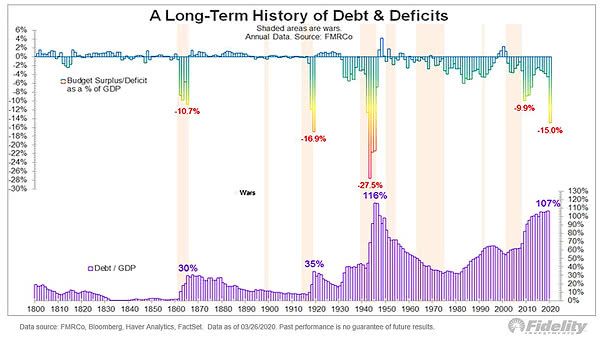
A Long-Term History of Debt & Deficits The U.S. federal deficit is skyrocketing and unusually large. Image: Fidelity Investments
A Long-Term History of Debt & Deficits The U.S. federal deficit is skyrocketing and unusually large. Image: Fidelity Investments
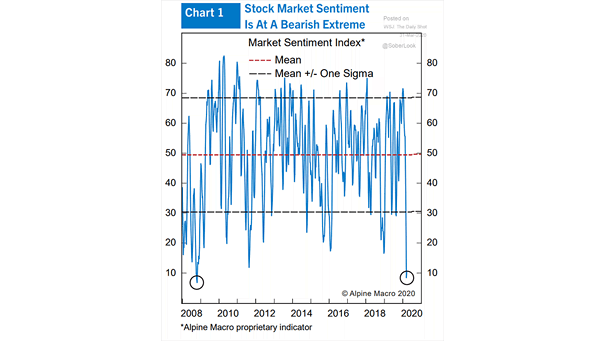
Market Sentiment Index The market sentiment index is at a bearish extreme, but the stock market can still decline further. Image: Alpine Macro
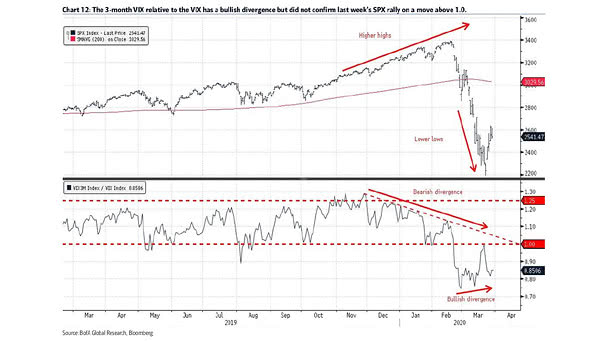
Volatility – 3-month VIX vs. VIX A sign of risk aversion, as the 3-month VIX relative to the VIX did not move above 1.0 and did not confirm last week’s S&P 500 rally. Image: BofA Global Research
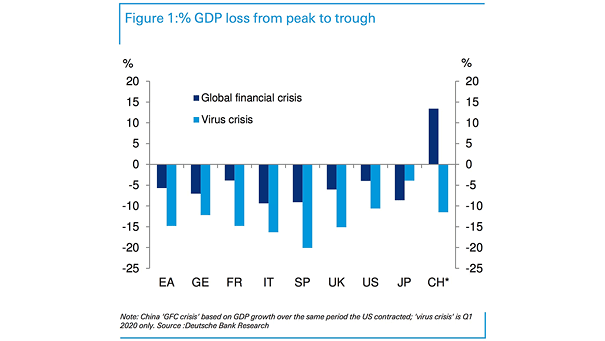
% GDP Loss from Peak to Trough – Coronavirus Crisis vs. Global Financial Crisis The peak-to-trough decline in the United States. and Euro Area, is likely to be more than double that of the global financial crisis. Image: Deutsche Bank Research
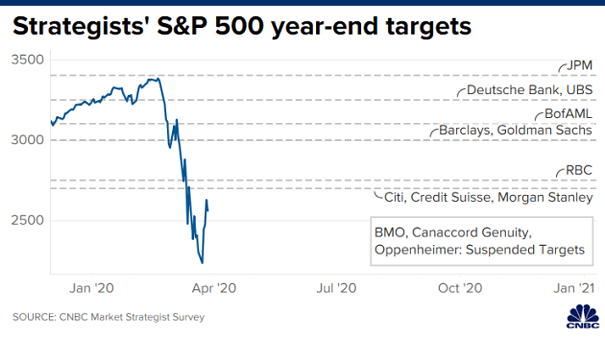
Strategists’ S&P 500 Year-End Targets Despite the extreme volatility, the consensus year-end target for the S&P 500 is now 3,038. Image: CNBC
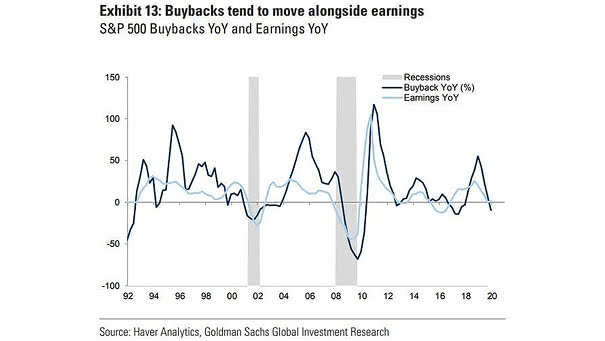
U.S. Buybacks vs. Earnings Buybacks tend to move alongside earnings and are likely to be reduced in 2020. Image: Goldman Sachs Global Investment Research
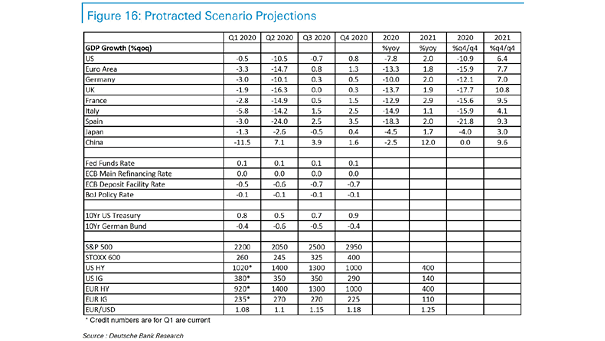
S&P 500, Treasury Bond, Global GDP, EUR/USD – Protracted Scenario Projections This table suggests protracted scenario projections. Image: Deutsche Bank Research
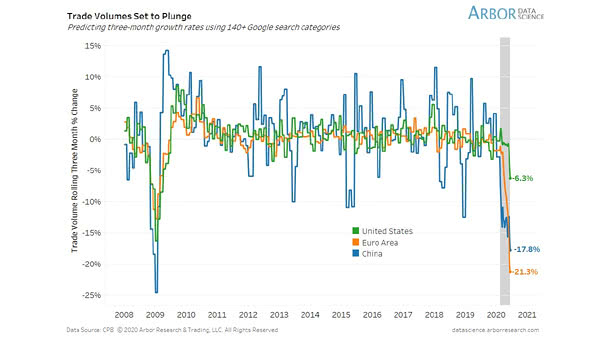
Trade Volumes Chart suggesting that trade volumes are expected to fall significantly. Image: Arbor Research & Trading LLC
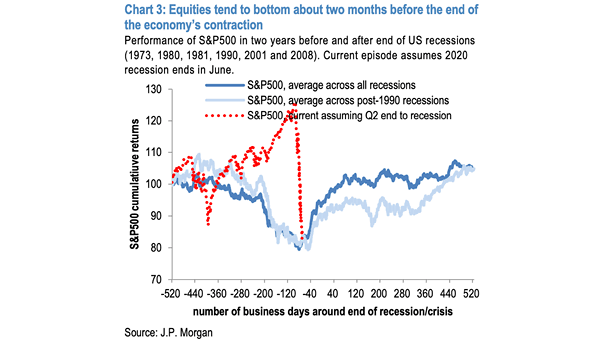
Performance of S&P 500 in Two Years Before and After End of U.S. Recessions This chart suggests that the current episode assumes 2020 recession ends in June, as equities tend to bottom about two months before the end of the economy contraction. Image: J.P. Morgan
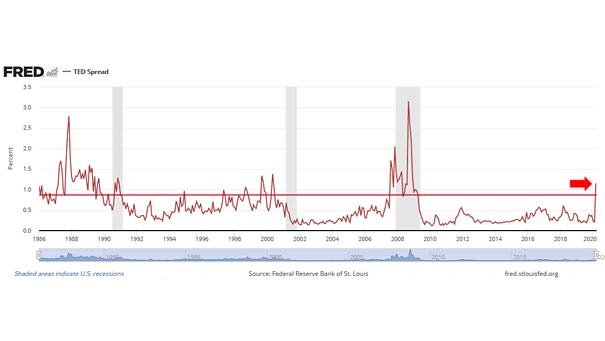
U.S. TED Spread The TED spread (spread between 3-month LIBOR and 3-month Treasury bill) shows that financial conditions are tightening at the fastest pace since the 2008 crisis.
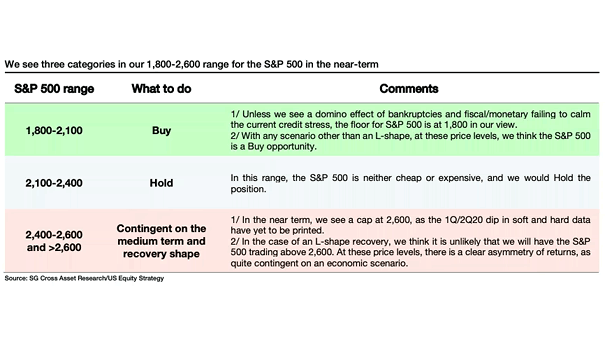
S&P 500 Range in the Near-Term This table suggests a 1,800-2,600 range for the S&P 500 in the near-term. Image: Societe Generale Cross Asset Research