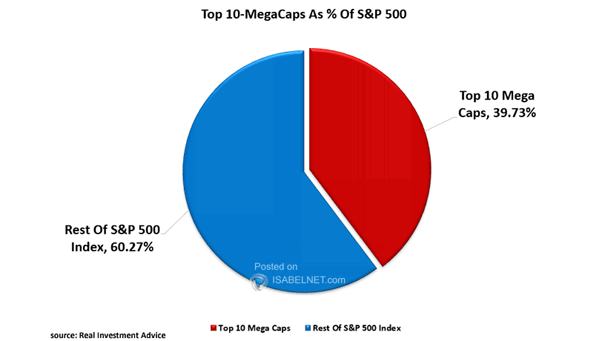
ISABELNET Cartoon of the Day
ISABELNET Cartoon of the Day As the S&P 500 tumbles 9.08% this week, bears are popping champagne, and bulls are asking, “Is there even a floor anymore?” Have a Great Weekend, Everyone! 😎
ISABELNET Cartoon of the Day As bears heard Trump’s tariffs were going to cause a bear market, bulls suddenly came down with a case of stagflation! Happy Friday, Everyone! 😎
EPS Revisions Typically, positive revisions in EPS increase stock market value and attract more investors, while negative revisions usually apply downward pressure on stock prices. Image: Goldman Sachs Global Investment Research
VIX Futures Curve Market participants are anticipating a potential decline in volatility, reflecting hopes for reduced uncertainty and stabilization of trade-related concerns impacting markets. Image: The Daily Shot
NBER Recession Dating vs. Market Realization Historically, the S&P 500 peaks and declines 6–16 months before the National Bureau of Economic Research (NBER) officially declares a U.S. recession, making it a reliable leading indicator. Image: Real Investment Advice
Average Daily Equity ETF Flow vs. S&P 500 Performance Despite the S&P 500’s decline in Q1 2025, investors continued pouring money into equity ETFs, averaging nearly $3bn daily inflows—a sign of persistent appetite for U.S. equities amid volatility. Image: Strategas Research Partners
Largest Calendar Year Peak to Trough S&P 500 Drawdown The S&P 500 has shown resilience over extended periods, often delivering positive annual returns despite experiencing significant intra-year volatility. Over the past 40 years, the median annual drawdown of the index has been 10%. Image: Goldman Sachs Global Investment Research
ISABELNET Cartoon of the Day Are tariffs the bears’ secret weapon? While bulls struggle with market volatility, bears may capitalize on the economic chaos triggered by trade barriers! Have a Great Day, Everyone! 😎
Quarterly Seasonality of S&P 500 Returns vs. STOXX Europe 600 U.S. equity returns tend to be strongest relative to Europe during the second quarter. Image: Goldman Sachs Global Investment Research
Trade Policy Uncertainty Indexes Uncertainty in trade policy often leads to positive future returns for the S&P 500, as markets tend to price in worst-case scenarios during unclear times. Once clarity emerges, stocks frequently recover. Image: Deutsche Bank
Bitcoin and Nasdaq 100 Bitcoin has demonstrated a strong correlation with the Nasdaq 100, reflecting broader market trends and investor sentiment. This relationship becomes particularly apparent as the current speculative mood encounters turbulence. Image: Topdown Charts