The World’s Biggest Oil Producers
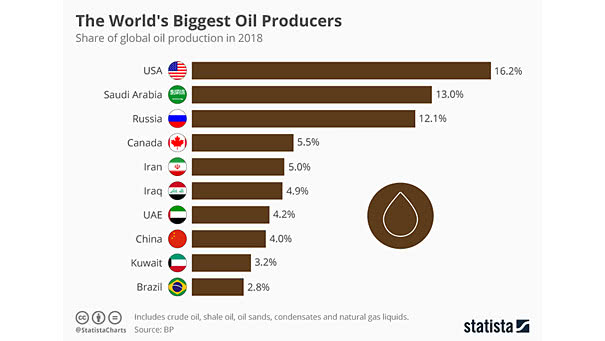
The World’s Biggest Oil Producers The U.S. is the first-largest producer of oil in the world, accounting for 16.2% of all production in 2018, and has surpassed Russia and Saudi Arabia. Image: Statista
The World’s Biggest Oil Producers The U.S. is the first-largest producer of oil in the world, accounting for 16.2% of all production in 2018, and has surpassed Russia and Saudi Arabia. Image: Statista
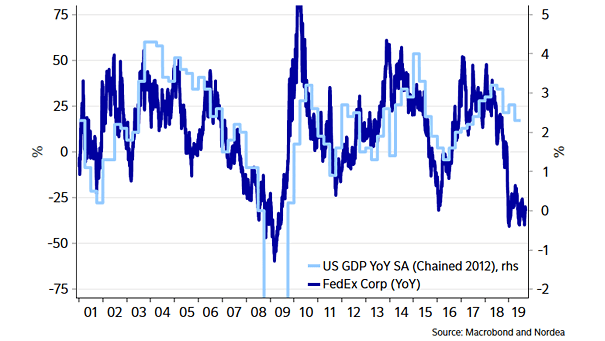
Fedex and U.S. GDP Interesting chart showing the pretty good correlation between FedEx and U.S. GDP. Image: Nordea and Macrobond
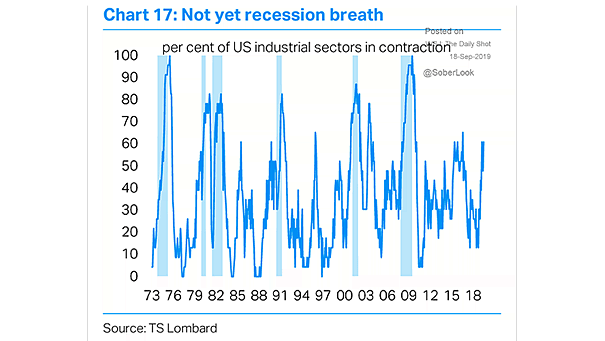
U.S. Industrial Sectors in Contraction Below Recession Levels Currently, the percentage of U.S. industrial sectors in contraction is below recession levels. Image: TS Lombard
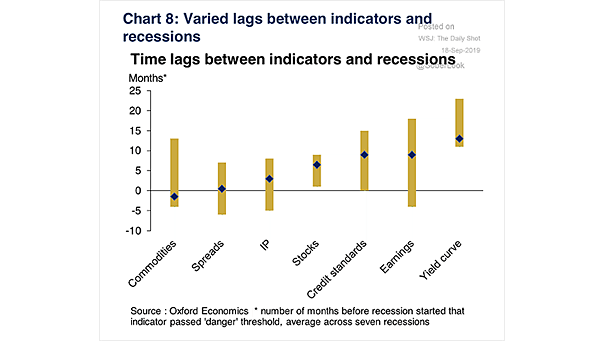
Time Lags Between Indicators and Recessions Chart showing that credit standards, earnings and the yield curve are the earliest recession indicators. Image: Oxford Economics
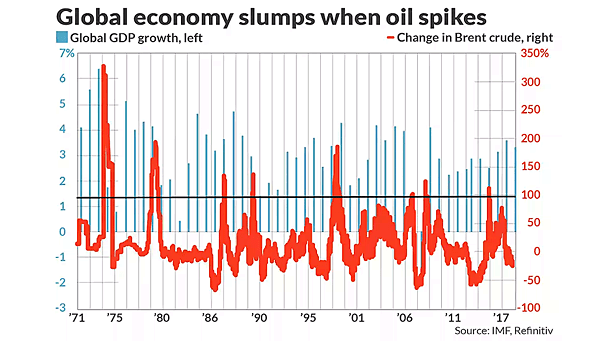
Global GDP and Brent Crude Oil Price High oil prices can cause recessions. Image: MarketWatch
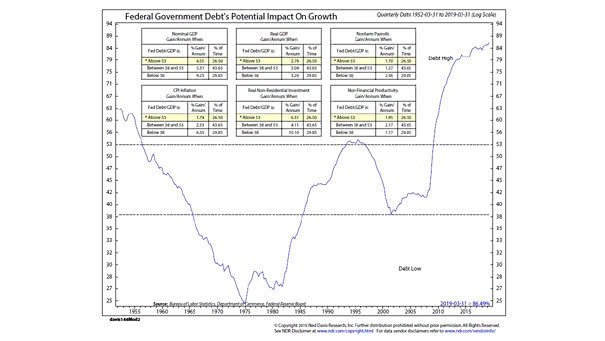
U.S. Federal Government Debt’s Potential Impact On Growth This chart puts the U.S. federal government debt’s potential impact on growth into perspective. Image: Ned Davis Research
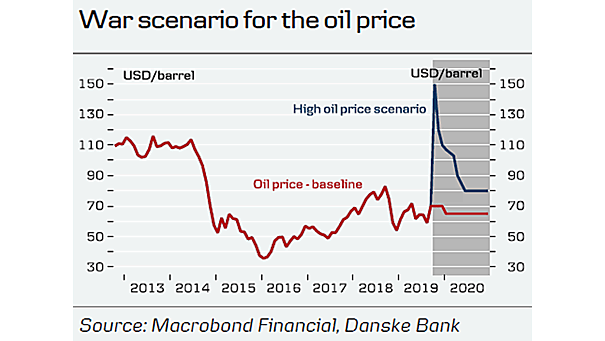
War Scenario for the Oil Price A war between U.S./Saudi Arabia and Iran could lead to soaring oil prices and a global recession. Image: Danske Bank Research

U.S. Long Bond This chart shows the U.S. long bond and its long-term trend line. Image: Fidelity Investments
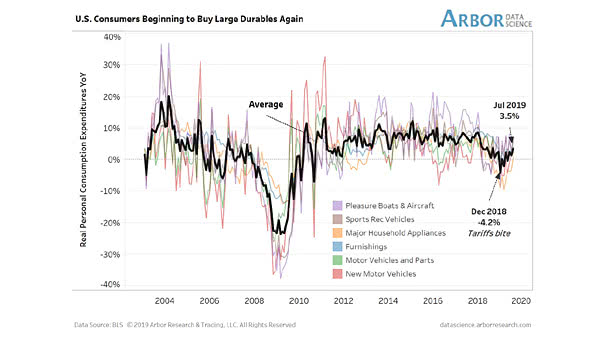
U.S. Consumers and Large Durables Good news for the U.S. economy! American consumers are buying large durables again, despite tariffs and trade uncertainty. Image: Arbor Research & Trading LLC
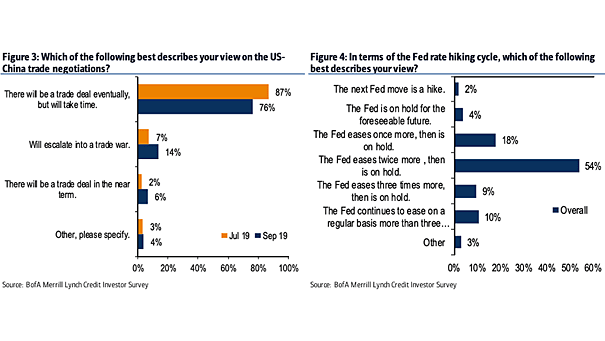
US-China Trade Deal – BofA Survey The September edition of the BofA survey shows that 76% of clients expect a trade deal eventually, but it will take time. Image: BofA Credit Investor Survey
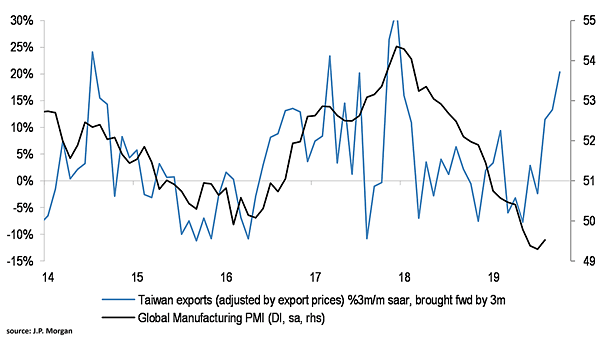
Taiwan Exports Lead Global Manufacturing PMI Interesting chart suggesting that Taiwan exports lead global manufacturing PMI by 3 months. Image: J.P. Morgan