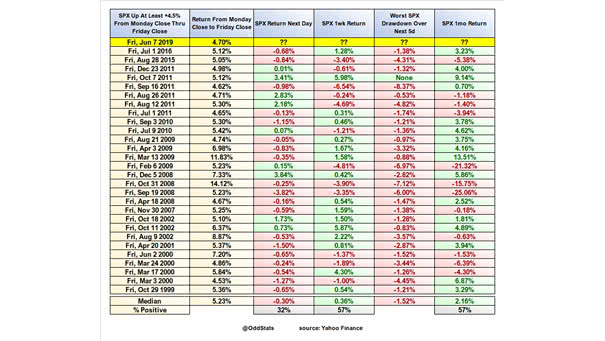
What Does Trump’s Economic Plan Look Like?
What Does Trump’s Economic Plan Look Like? A basic formula explains Trump’s economic policies to “Make America Great Again.” Image: Hayek and Keynes
Estimated Number of Hedge Funds Launched or Closed since 2008 Can hedge funds deliver higher returns than passive investing? Not really. But many investors still think they can achieve higher returns with active trading than with passive investing. The chart below shows that it is really hard to outperform the market. As Warren Buffett said,…
Mutual Fund Flows – Asset Allocation Funds since 2000 Dynamic/flexible and balanced funds saw significant outflows since 2018. It is obvious that many investors don’t have a long-term view. Image: Topdown Charts
Decomposing the U.S. 10-Year minus 3-Month Treasury Yield Spread since 2013 This great chart shows that the “Global Economic Data” variable has a significant impact on the U.S. 10-year minus 3-month Treasury yield spread since 2018. An R² of 0.902 means that more than 90 percent of the variance in the U.S. 10-year minus 3-month Treasury yield spread…
Can The U.S. 10-Year Treasury Yield Fall Further? Well, according to this chart, the U.S. 10-year treasury yield could fall further. The chart suggests that G4 central bank assets as percentage of GDP (1-year change) lead U.S. 10-year Treasury yield (1-year change) by one year. Image: Macrobond
The U.S. Corporate Bond Debt Rated ‘BBB’ Exceeds $3 trillion The U.S. corporate bond debt rated ‘BBB’ exceeds $3 trillion. That’s 53% of investment-grade bonds in the United States. Any drop in the credit ratings could amplify the next recession: many investment grade investors own BBB-rated bonds, but are not allowed to hold junk-rated bonds.…
Total Global Carbon Emissions (CO2) China, the United States, and India account for almost half the world’s carbon emissions. You may also like “Annual Carbon Emissions in Tons.” Image: Visual Capitalist
University of Michigan Consumer Sentiment Index – Democrats vs. Republicans This chart shows that Democrats and Republicans have a completely different view of the U.S. economy. Democrats see a recession coming and Republicans see economic growth. Image: John Kemp
Expected Fed Funds Rate as of June 1, 2019 Traders are pricing in two full cuts in the fed funds target before the end of 2019. Fed funds futures for January 2020 imply an expected rate of only 1.85%. Let’s hope the Fed gets the message from the market. You may also like “Markets Have…
Distribution of Forward Returns by 200MA Slope This great chart shows the distribution of forward returns when the slope of S&P 500’s 200-day moving average is lower, flat or higher. Image: Ritholtz Wealth Management
The Fed Fund Futures Market Is Pricing Three Rate Cuts Over the Next 12 Months According to CME Group, the Fed fund futures market is pricing three rate cuts over the next 12 months. You may also like “Markets Have Accurately Priced in Cuts before Easing Cycles Begin“ Image: Bianco Research LLC