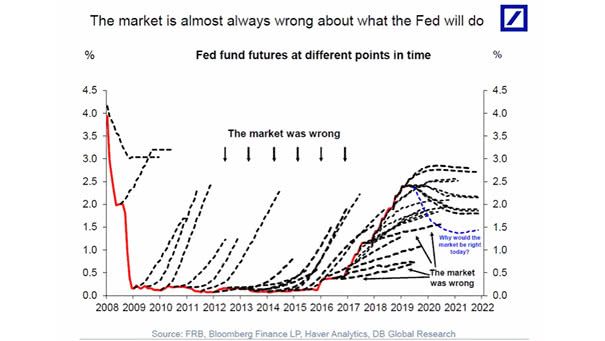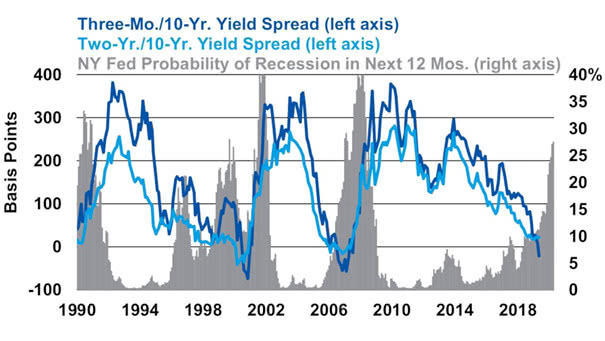
New York Fed Probability of Recession in Next 12 Months since 1990
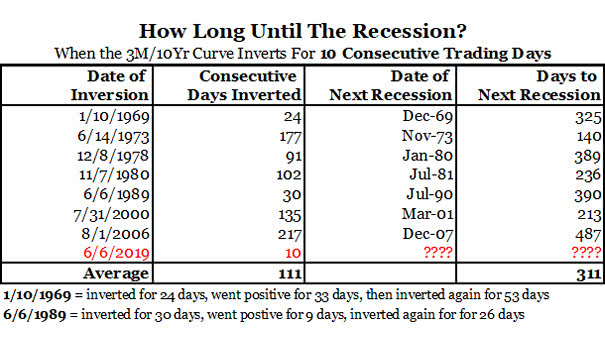
New York Fed Probability of Recession in Next 12 Months since 1990 When an inverted yield curve occurs, short-term interest rates exceed long-term rates. It suggests that the long-term economic outlookis poor and that the yields offered by long-term fixed income securities will continue to decline. Since 1962, no recession has occurred without an inverted…