The Rise of ETFs May Distort the Stock Market
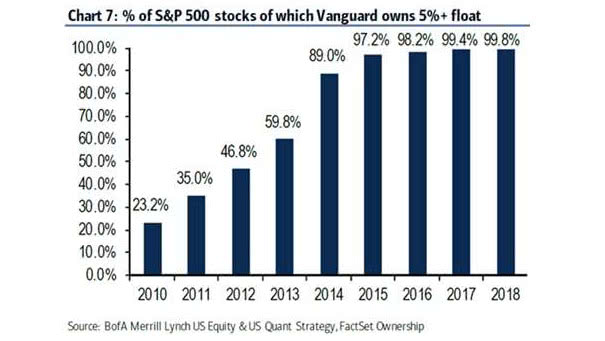
The Rise of ETFs May Distort the Stock Market Vanguard holds more than a 5% stake in 99.8% S&P 500 stocks. Image: BofA Merrill Lynch
The Rise of ETFs May Distort the Stock Market Vanguard holds more than a 5% stake in 99.8% S&P 500 stocks. Image: BofA Merrill Lynch
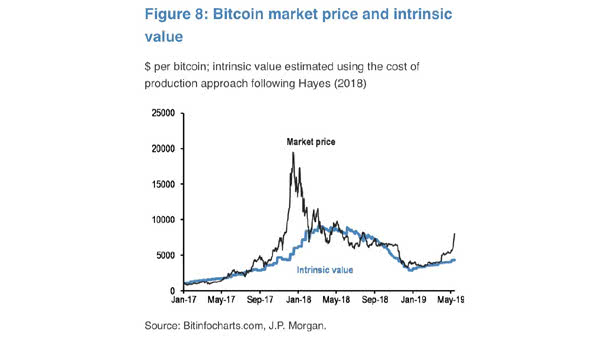
Does Bitcoin Have Intrinsic Value? Well, although skeptics say Bitcoin has no value, JP Morgan says Bitcoins have “intrinsic value” using the cost of production approach following Hayes. See: Adam Hayes, A Cost of Production Model for Bitcoin (March 19, 2015).
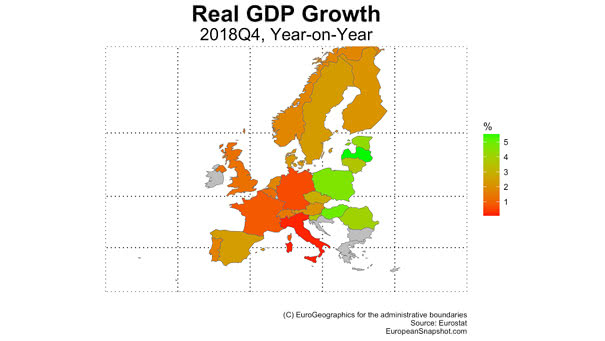
European Economic Slowdown – Real GDP Growth 2018Q4 Is Europe’s slowdown severe? Well, this great chart shows real GDP growth in 2018Q4. Image: European Economic Snapshot
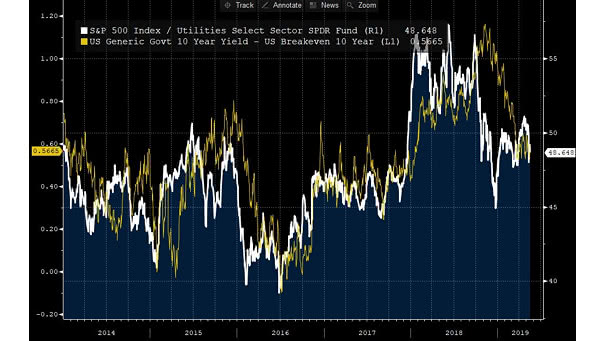
For the Last Few Years, Equity Markets Have Been Leading Bond Markets When both markets do not react simultaneously, then one market leads the other and the securities are mispriced temporarily. Image: Hayek and Keynes
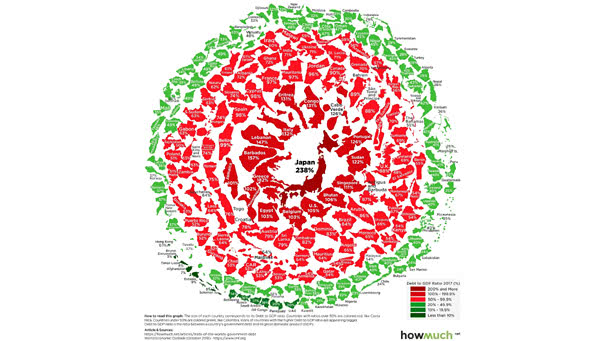
What Does Government Debt Look Like Across the Globe? Government debt has risen to over $63 trillion in absolute terms. Japan is the most indebted countries in the world, with debt-to-GDP ratio of 237.6% in 2017. The United States debt-to-GDP ratio is 105.2% in 2017. Image: howmuch.net

“Ken Fisher: Thinking in Ways That Others Do Not, with John Tamny” Great interview of Ken Fisher on: coastal redwoods, dikes and climate change, efficient markets, quantitative easing (QE) vs. inflation, humans as a group are slow to learn, recessions, Fed and interest rates, why philanthropy is bad and immoral, and why inequality is a good…
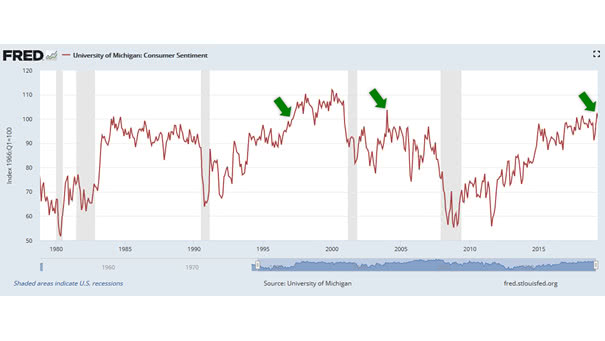
The University of Michigan Consumer Confidence Sentiment Index Hit a 15-Year High Last time, it hit this level was in May 1997 and January 2004. That’s good news, because this level suggests that there is no imminent recession on the horizon.
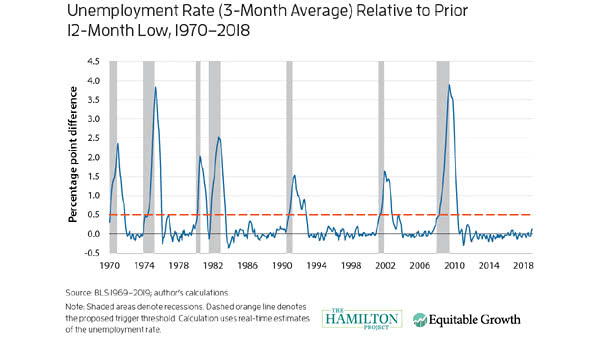
Recession Indicator – Unemployment Rate (3-Month Average) Relative to Prior 12-Month Low Even if the unemployment rate is a lagging indicator, the “Sahm recession indicator” forecasts a recession when the 3-month moving average national unemployment rate exceeds its minimum over previous 12 months by 0.5 percentage points. Picture source : Claudia Sahm, Board of Governors…
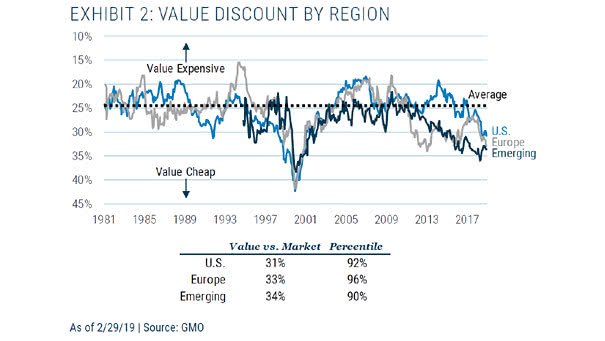
Are Value Stocks Cheap or Expensive? Value stocks usually trade at a 24% discount to the stock market.But as of 02/29/2019, they are trading at 31% discounts in the U.S., 33% discounts in Europe and 34% discounts in emerging countries. Image: GMO
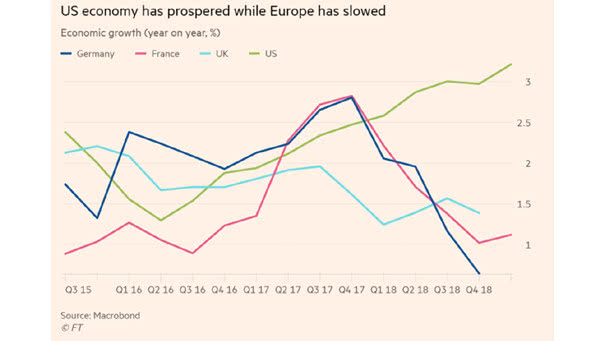
U.S. Economy Has Prospered While Europe Has Slowed This chart shows how the US economy is strong compared to European countries. And despite full employment, US real GDP should stay above potential GDP. Image: Financial Times
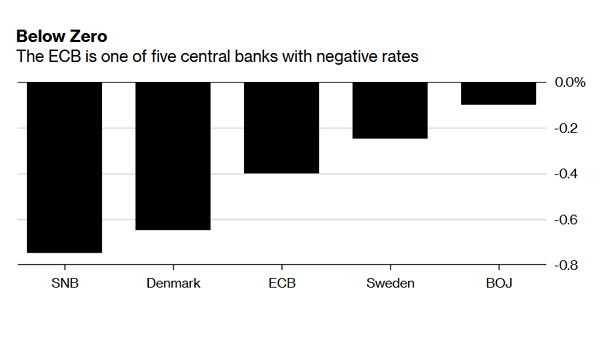
Five Central Banks With Negative Rates Money markets expect the ECB will cut rates by Q1 2020. Image: Bloomberg