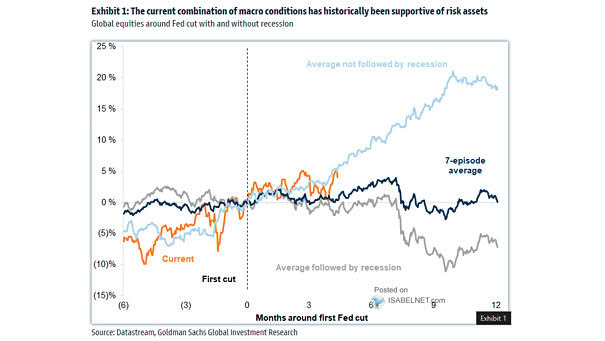
Global Equities Around Fed Cut With And Without Recession

Global Equities Around Fed Cut With And Without Recession Strong performance in global equities is common after the Fed’s initial rate cut, particularly when the economy remains recession-free for the subsequent 12 months. Image: Goldman Sachs Global Investment Research
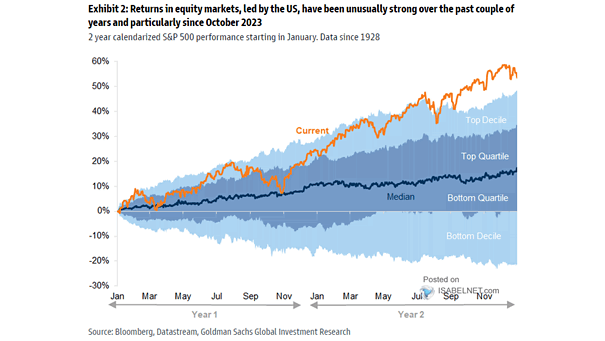
2 Year Calendarized S&P 500 Performance Starting in January

2 Year Calendarized S&P 500 Performance Starting in January The remarkable rise in the S&P 500 over the past two years is one of the strongest since 1928, bringing joy to market bulls. Image: Goldman Sachs Global Investment Research

ISABELNET Cartoon of the Day

ISABELNET Cartoon of the Day The Panama Canal is not for sale. Trying to buy it? That’s a canal-tastrophic idea! Have a Great Day, Everyone! 😎

CEO Confidence vs. S&P 500 Annual % Change

CEO Confidence vs. S&P 500 Annual % Change Strong CEO confidence typically bodes well for U.S. stocks, as there’s a correlation between executive optimism and annual market performance. Image: Real Investment Advice

The S&P 500 Index Returns Based on the Year of the Snake

The S&P 500 Index Returns Based on the Year of the Snake 🐍 Happy New Year of the Snake! While it is not advisable to invest solely based on zodiac signs, investors celebrating the Year of the Snake are advised to remember: sometimes the market strikes when you least expect it! Image: Carson Investment Research

DXY U.S. Dollar Index vs. Nasdaq Composite / MSCI World Value

DXY U.S. Dollar Index vs. Nasdaq Composite / MSCI World Value Over the past two years, U.S. growth stocks—known for their sensitivity to currency fluctuations—have exhibited a strong correlation with the U.S. dollar. Image: Gavekal, Macrobond

S&P 500 Performance by January Return

S&P 500 Performance by January Return Bulls have reason to smile: Since 1950, when January has shown positive returns, the S&P 500 has ended the year positively 89% of the time, with an average annual gain of 19%. Image: Fundstrat Global Advisors, LLC

S&P 500 Valuation vs. History

S&P 500 Valuation vs. History Compared to historical standards, most S&P 500 sector P/E valuations are elevated, raising concerns about potential market overvaluation. Image: Goldman Sachs Global Investment Research

ISABELNET Cartoon of the Day

ISABELNET Cartoon of the Day Why are bears reluctant to invest in U.S. stocks? They view the bull market as nothing more than fake news—and they can’t bear the idea of losing their cherished money (or honey)! Have a Great Week, Everyone! 😎

Valuation – Nasdaq 100 Fwd P/E

Valuation – Nasdaq 100 Fwd P/E Tech stocks are priced at a premium, with forward valuations significantly above their 10-year average. This rich valuation assumes technology companies will maintain their earnings leadership. Image: Bloomberg