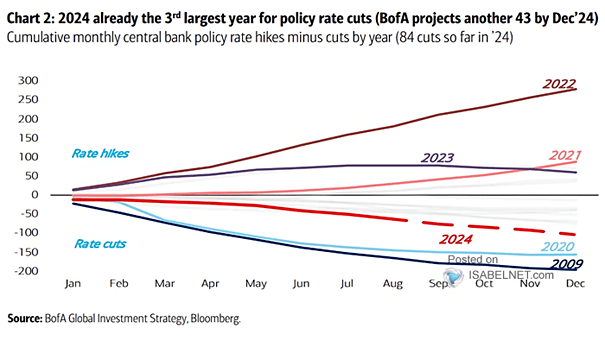
Interest Rates – Cumulative Rate Cuts vs. Hikes
Interest Rates – Cumulative Rate Cuts vs. Hikes In 2024, global central banks are expected to implement significant policy rate cuts, marking it as the third largest year for such reductions in history, driven by…