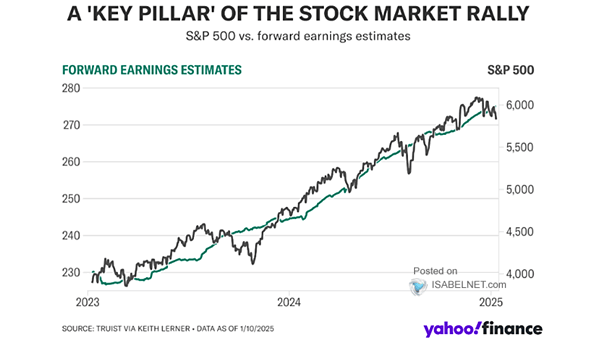
ISABELNET Cartoon of the Day

ISABELNET Cartoon of the Day With the S&P 500 hitting a new all-time high, bears are looking for a pardon! It’s already Wednesday, Happy “Hump” Day, Everyone! 🐫🐪😎

Inflation – U.S. Core PCE Deflator

Inflation – U.S. Core PCE Deflator The recent stalling of disinflationary progress in U.S. core PCE deflator could complicate the Federal Reserve’s monetary policy decisions. Image: Deutsche Bank

U.S. Tech Stocks vs. China Tech Stocks

U.S. Tech Stocks vs. China Tech Stocks As the U.S. market experiences an AI frenzy, China’s major technology stocks struggle, reflecting investor pessimism towards China’s economic revival efforts and concerns about AI monetization and trade…

S&P 500 Return – Year 3 of Bull Market

S&P 500 Return – Year 3 of Bull Market Like a kid who loses interest in his favorite toy after two years, the S&P 500 tends to slow down in the third year of a…

ISABELNET Cartoon of the Day

ISABELNET Cartoon of the Day In a bull market, asking a bear how to make more money is like asking a cat to take a bath—neither is likely to cooperate, especially with the U.S. stock…

S&P 500 Performance After Major Milestone Levels Are Hit

S&P 500 Performance After Major Milestone Levels Are Hit Market optimism is so high, even bears are buying “Bull Market 2025” t-shirts, as the S&P 500 index has consistently risen in the six months following…

S&P 500 Ratio to Stoxx 600

S&P 500 Ratio to Stoxx 600 The S&P 500’s performance relative to the Stoxx 600 has hit the upper limit of its long-term channel. While U.S. equities may continue to lead due to strong growth…

Annual Performance of S&P 500

Annual Performance of S&P 500 With a year-to-date return of 26.47%, the S&P 500 index has delivered remarkable gains in 2024, ranking it among the best performances of the century. Image: Bloomberg

Implied Equity Allocation by U.S. Households

Implied Equity Allocation by U.S. Households Periods of high household equity allocation have historically been followed by lower market returns, implying that current trends might indicate potential risks for future investors. Image: J.P. Morgan