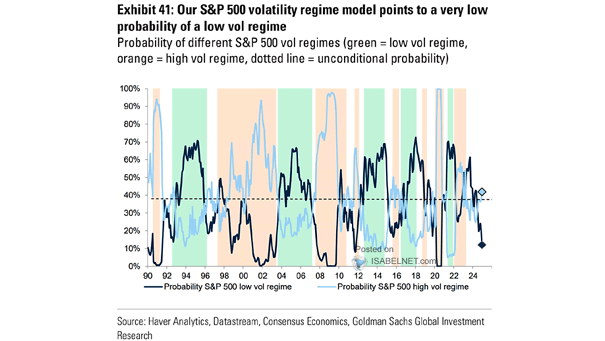
S&P 500 Stocks – Average Earnings Day Moves

S&P 500 Stocks – Earnings Day Moves Last quarter set a 15-year record for earnings day volatility, with 12% of S&P 500 stocks experiencing price movements greater than 10%. Image: Goldman Sachs Global Investment Research

U.S. Stocks – Cyclicals vs. Defensives

U.S. Stocks – Cyclicals vs. Defensives Investor sentiment is often reflected in the performance of cyclicals versus defensives. Typically, expectations of economic growth lead to a preference for cyclicals, resulting in their outperformance relative to…

Recession – NFIB Sales Expectations

Recession – NFIB Sales Expectations Optimism among U.S. small business owners regarding future sales has significantly declined, with many anticipating a drop in revenues over the coming months. Image: Real Investment Advice

10-Year Turnover of S&P 500 Constituents

10-Year Turnover of S&P 500 Constituents Over a typical 10-year period, 36% of S&P 500 constituents experience turnover. This level of turnover is significant, highlighting the challenges of tracking long-term performance for individual firms within…

Cumulative Advance-Decline Line for the S&P 500 Index

Cumulative Advance-Decline Line for the S&P 500 Index The S&P 500 advance-decline line is a crucial indicator of market trends and sentiment. An all-time high typically indicates favorable news for the U.S. stock market. Image:…

Copper to Gold Ratio and U.S. 10-Year Treasury Yield

Copper to Gold Ratio and U.S. 10-Year Treasury Yield The copper-to-gold ratio is often considered a leading indicator for the direction of the 10-year U.S. Treasury yield under certain market conditions. Image: The Daily Shot

10-Year Annualized S&P 500 Returns

10-Year Annualized S&P 500 Returns Goldman Sachs predicts that the S&P 500 will achieve an average annualized return of only 3% in the coming decade, considerably below historical norms, reflecting concerns about high equity valuations.…

Global M2 Liquidity

Global M2 Liquidity The increase in global M2 money supply suggests that liquidity is on the rise, which is likely to stimulate economic activity and push equity markets higher. Image: Morgan Stanley Research

U.S. Corporate Income Tax Rate

U.S. Corporate Income Tax Rate The trend of declining effective tax rates among S&P 500 companies reflects broader economic shifts and policy decisions that have shaped the landscape of corporate taxation in the United States.…

S&P 500 Performance After 6-Week Win Streaks

S&P 500 Performance After 6-Week Win Streaks Since 1950, 6-week win streaks have generally been bullish for U.S. stocks, averaging an 11.1% increase in value one year later, which gives investors strong reasons to expect…

S&P 500 and Odds of Winning U.S. Presidential Election

S&P 500 and Odds of Winning U.S. Presidential Election The rising odds for Trump in prediction markets have been closely tied to an upswing in S&P 500 prices, reflecting investor sentiment that aligns with potential…