Bond Flows
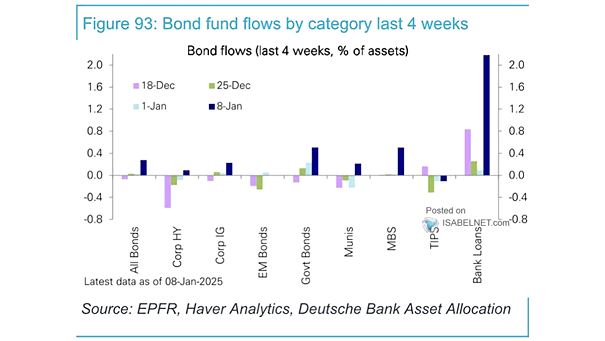
Bond Flows The current interest rate environment has created an attractive landscape for bank loan funds, driving robust inflows. Image: Deutsche Bank Asset Allocation
Bond Flows The current interest rate environment has created an attractive landscape for bank loan funds, driving robust inflows. Image: Deutsche Bank Asset Allocation
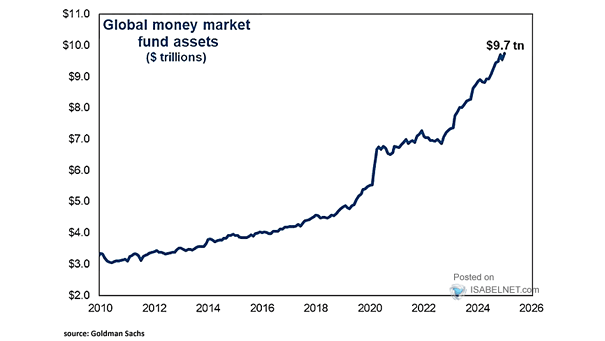
Global Money Market Fund Assets Global money market fund assets hit a new all-time high of $9.7 tn, highlighting the perceived security and attractiveness of these funds as a viable approach for temporarily storing and…
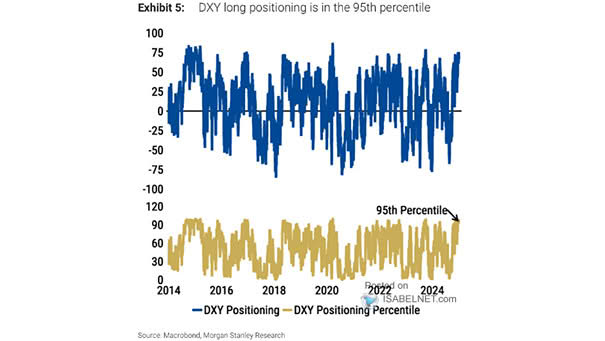
U.S. Dollar Index Positioning The U.S. Dollar Index long positioning being in the 95th percentile indicates an extremely bullish sentiment towards the U.S. dollar, potentially indicating that it is overvalued. Image: Morgan Stanley Research

ISABELNET Cartoon of the Day It’s inflation day, and bulls are happier than a kid in a candy store—except this time, the candy costs twice as much! Happy “Hump” Day, Everyone! 🐫🐪😎
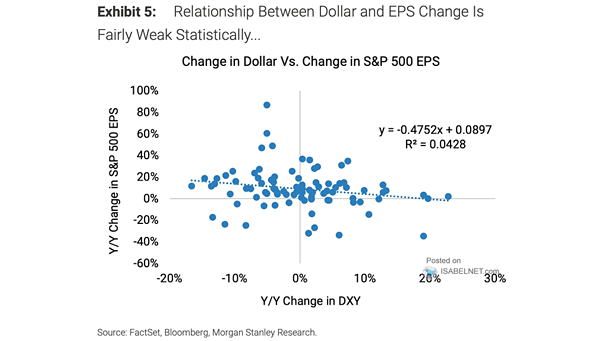
Change in U.S. Dollar vs. Change in S&P 500 EPS While there are instances where the U.S. Dollar and S&P 500 EPS may move in tandem, the overall statistical relationship is weak. Image: Morgan Stanley…
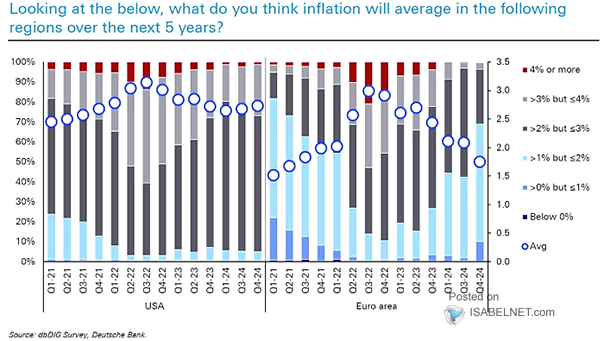
Survey – U.S. Inflation and EU Inflation Inflation expectations are diverging sharply between the United States and Europe. While inflation in the U.S. shows signs of recovery, European expectations have notably declined, dipping below 2%…
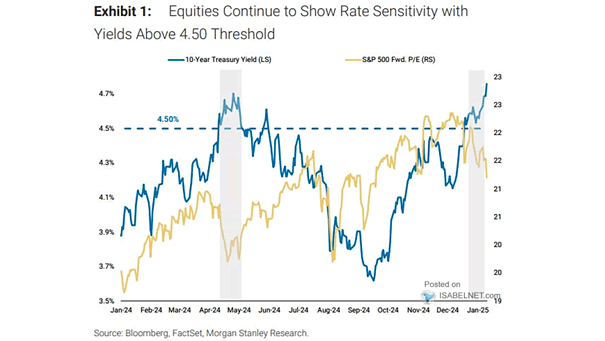
Valuation – S&P 500 Forward P/E Ratio vs. 10-Year U.S. Treasury Yield The 10-year U.S. Treasury yield surpassing 4.5% is creating a headwind for equity valuations and potentially dampening investor sentiment. Image: Morgan Stanley Wealth…

ISABELNET Cartoon of the Day Ignoring climate risks in your portfolio is like wearing a parka in a sauna—you might feel cozy now, but you’re in for a sweaty surprise later! Have a Great Day,…
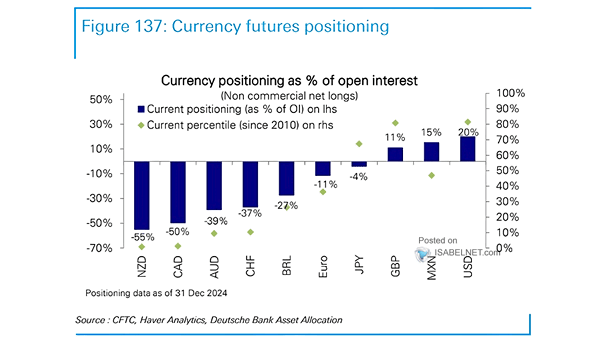
Currency Futures Positioning Despite already high U.S. dollar positioning, Goldman Sachs has upgraded its forecast for the U.S. dollar, expecting it to rally by about 5% in the next 12 months. Image: Deutsche Bank Asset…
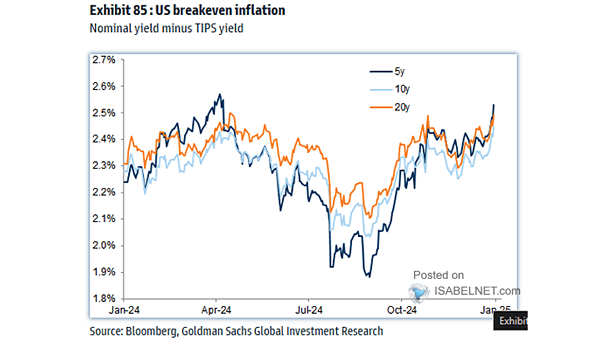
U.S. Breakeven Inflation Rate While U.S. inflation breakeven rates have been moving higher recently, inflation expectations remain relatively well-anchored, which is crucial for maintaining price stability and economic confidence. Image: Goldman Sachs Global Investment Research
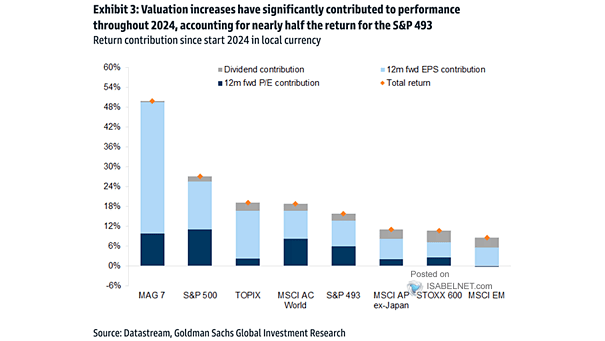
Percentage Contribution of Returns Between Dividends, Earnings and Valuation While multiple expansion has played an important role in boosting S&P 500 returns, future performance may depend more on earnings growth. Image: Goldman Sachs Global Investment…