U.S. Dollar Index Positioning
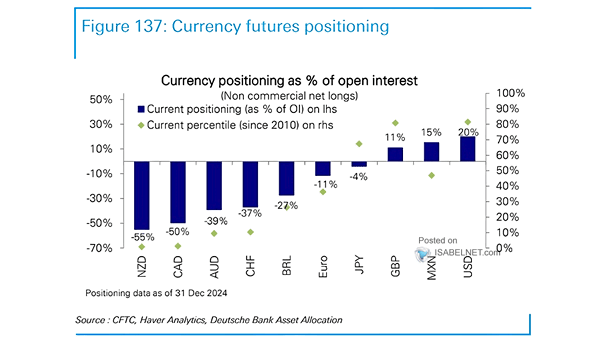
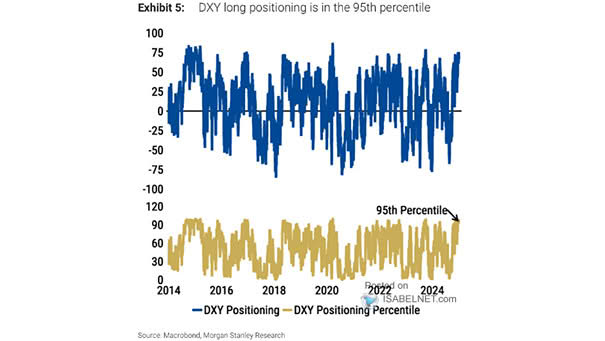
U.S. Dollar Index Positioning The U.S. Dollar Index long positioning being in the 95th percentile indicates an extremely bullish sentiment towards the U.S. dollar, potentially indicating that it is overvalued. Image: Morgan Stanley Research