U.S. Presidential Election
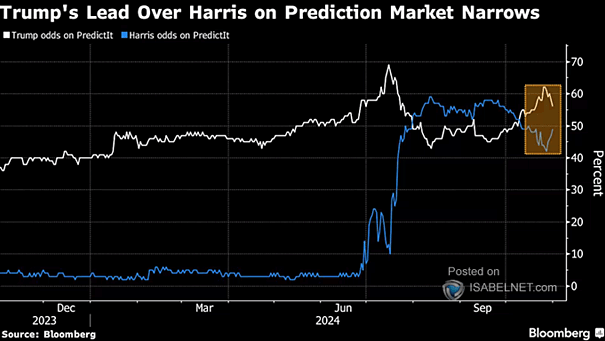
U.S. Presidential Election Recent prediction market data indicates that the gap between Donald Trump and Vice President Kamala Harris in the 2024 U.S. presidential race is narrowing. Image: Bloomberg
U.S. Presidential Election Recent prediction market data indicates that the gap between Donald Trump and Vice President Kamala Harris in the 2024 U.S. presidential race is narrowing. Image: Bloomberg

S&P 500 3-Month Seasonality Returns Will the U.S. stock market keep investors smiling? The three-month period of November through January has traditionally been the strongest for U.S. stock market performance. Image: Carson Investment Research
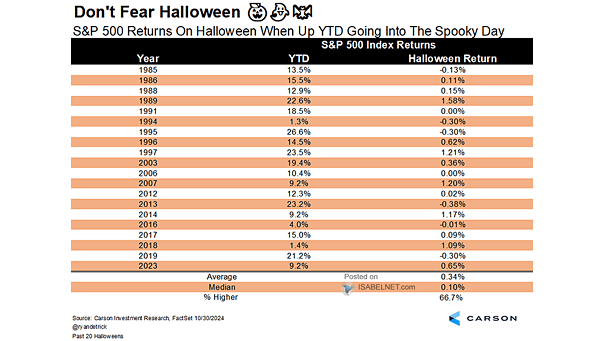
S&P 500 Returns on Halloween When Up YTD Going into the Spooky Day The S&P 500 rarely experiences major declines on Halloween. In the last three decades, when the index was positive for the year,…
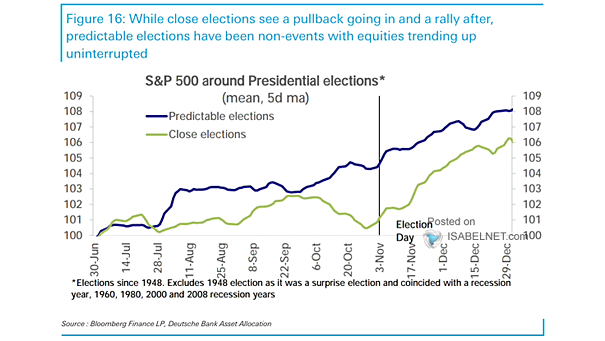
S&P 500 Around Predictable U.S. Presidential Elections While U.S. elections can create anxiety and volatility due to policy uncertainties, predictable elections often coincide with continued market trends and reduced market volatility. Image: Deutsche Bank Asset…
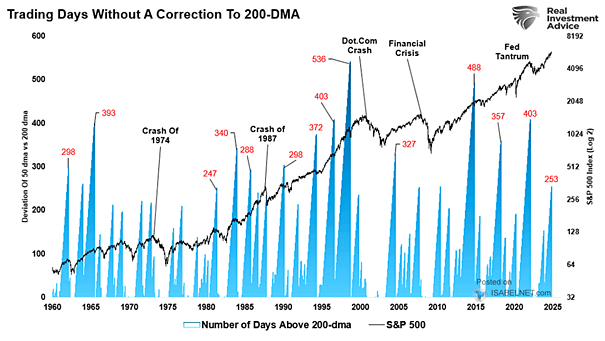
S&P 500 and Days Without a Correction to 200-Day Moving Average The S&P 500 is experiencing an impressive streak of 253 trading days without a correction to its 200-day moving average, indicating strong bullish momentum…
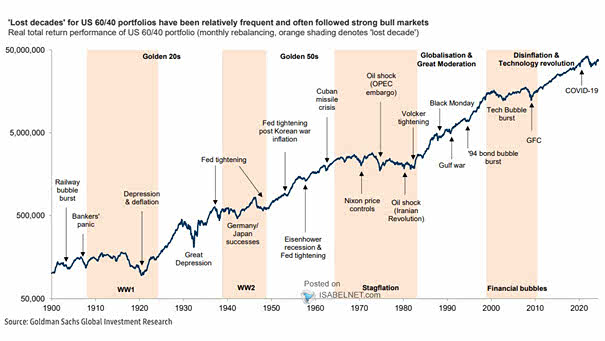
Real Total Return Performance of U.S. 60/40 Portfolio The term “lost decade” for the traditional 60/40 portfolio holds historical significance, especially during the period from 2000 to 2009, when investors faced a real loss. Image:…
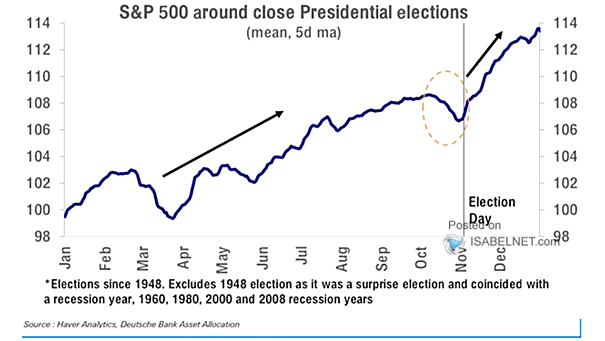
S&P 500 Around Close Presidential U.S. Elections Election Day frequently serves as a catalyst for the S&P 500, with the index typically surging as political uncertainties give way to clarity. Image: Deutsche Bank
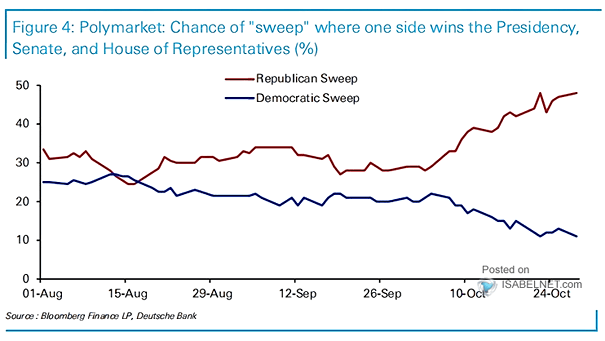
U.S. Election Scenario Probability As Republicans gain momentum heading into the U.S. elections, the prospect of their sweeping victory raises both hopes for short-term economic gains and fears of larger deficits and sustained inflationary pressures.…
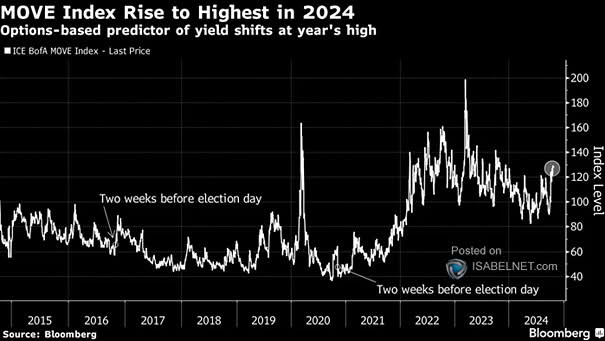
MOVE – U.S. Treasury Volatility Index The MOVE index, which measures implied volatility in U.S. Treasury options, has surged to its highest level since January 2024, signaling potential shifts in broader financial markets. Image: Bloomberg
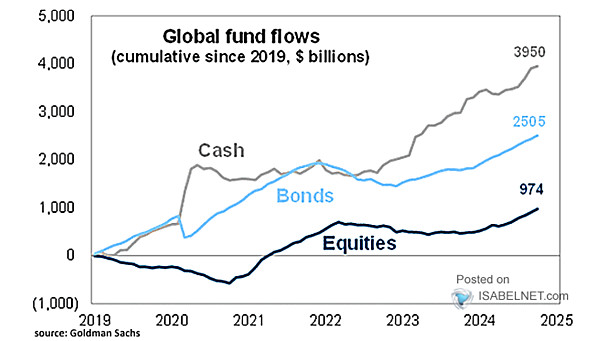
Global Fund Flows Cash, equity, and bond funds globally are experiencing significant inflows, indicating a growing confidence in diversified asset allocation strategies. Image: Goldman Sachs Global Investment Research
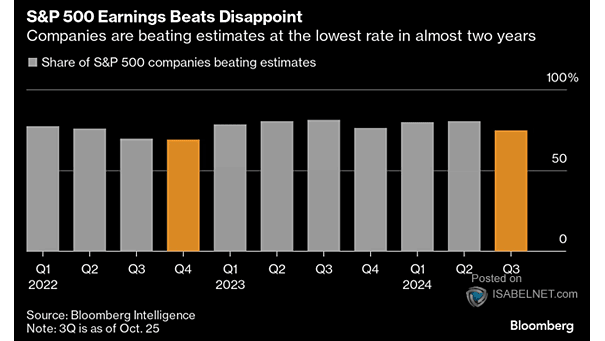
Percentage of Companies Beating Earnings Estimates by Quarter S&P 500 companies are experiencing a notable decline in their earnings performance, with the rate of companies beating earnings estimates at its lowest in nearly two years.…