S&P 500 and U.S. High Yield OAS
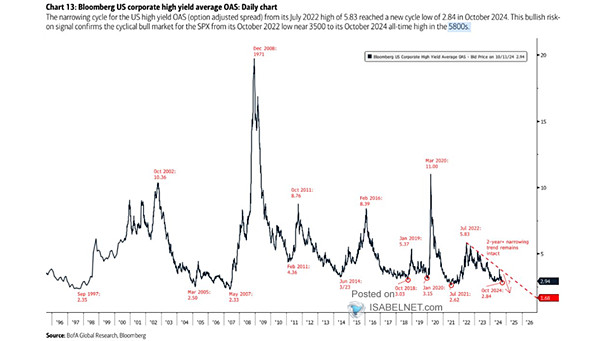
S&P 500 and U.S. High Yield OAS The new cycle low in the U.S. high yield option-adjusted spread is seen as a promising signal for the S&P 500, supporting bullish expectations as we approach the…
S&P 500 and U.S. High Yield OAS The new cycle low in the U.S. high yield option-adjusted spread is seen as a promising signal for the S&P 500, supporting bullish expectations as we approach the…
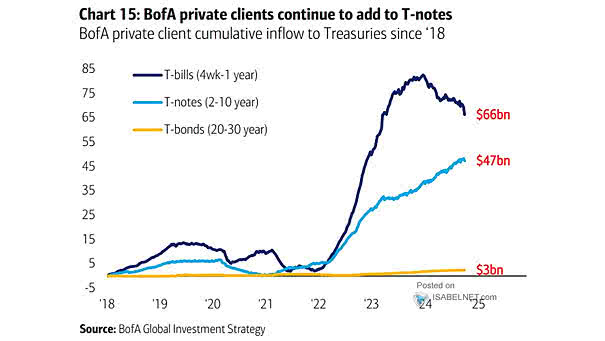
Treasuries Flows BofA’s private clients are increasingly favoring U.S. Treasuries, particularly those with maturities between 2 to 10 years, as they anticipate a decline in yields in the near future. Image: BofA Global Investment Strategy
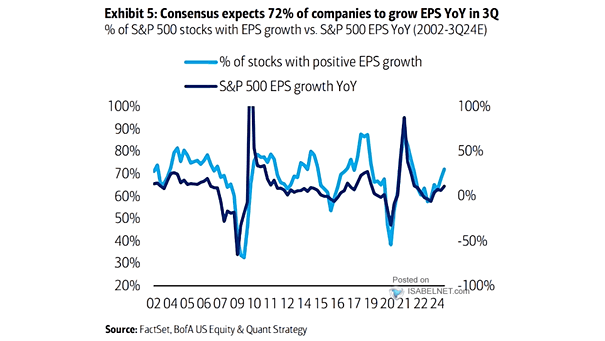
S&P 500 EPS Growth Consensus estimates suggest that 72% of S&P 500 companies are projected to report EPS growth in 3Q24, reflecting a broader trend of improving earnings outlooks across various sectors. Image: BofA US…
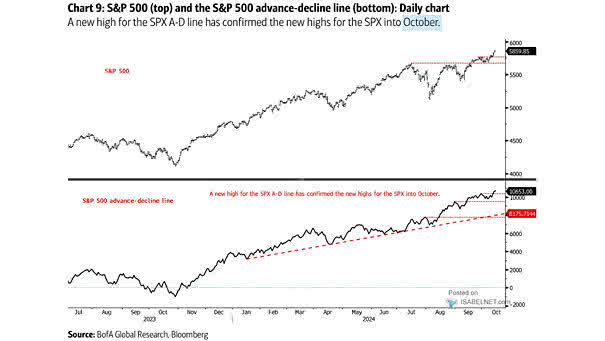
S&P 500 Advance-Decline Line The S&P 500 advance-decline line serves as an essential indicator of market trends and sentiment. When it hits an all-time high, it typically signals positive news for the U.S. stock market.…
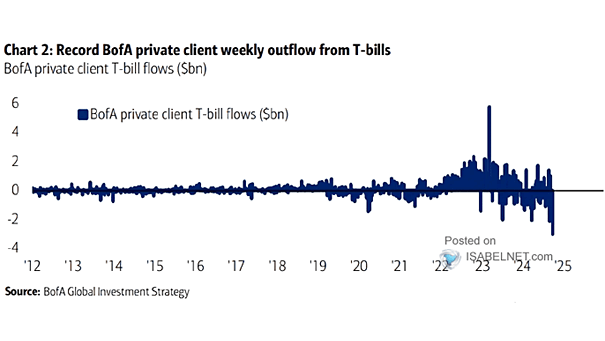
GWIM T-Bill Flows In light of the Fed’s recent rate cuts, BofA’s private clients are actively selling T-bills and strategically positioning themselves for potential gains in other asset classes. Image: BofA Global Investment Strategy
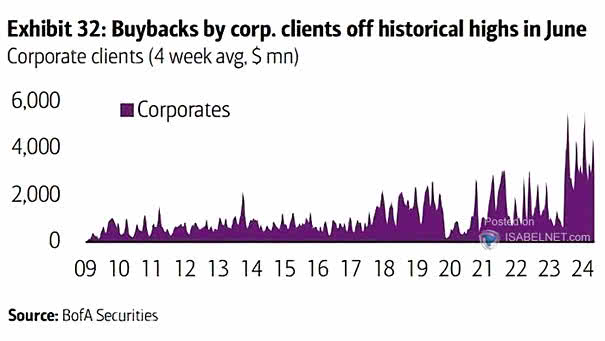
Corporate Clients – Buybacks (4-Week Average) Strong buyback activity from BofA’s corporate clients, exceeding historical averages, is a positive sign for investors, reflecting confidence in future growth prospects. Image: BofA Securities
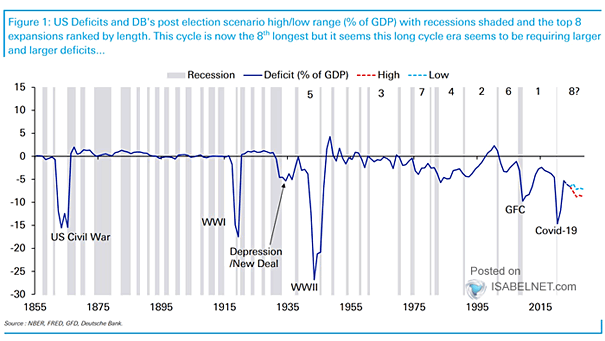
U.S. Deficits While higher deficits can stimulate economic growth and extend business cycles through increased government spending and investment, they also pose significant risks to long-term economic stability. Image: Deutsche Bank
FMS Investors – Average Percentile Rank of Growth Expectations, Cash Allocation, Equity Allocation The decline in pessimism among FMS investors is viewed as a positive indicator, suggesting a growing willingness to embrace risk. Image: BofA…
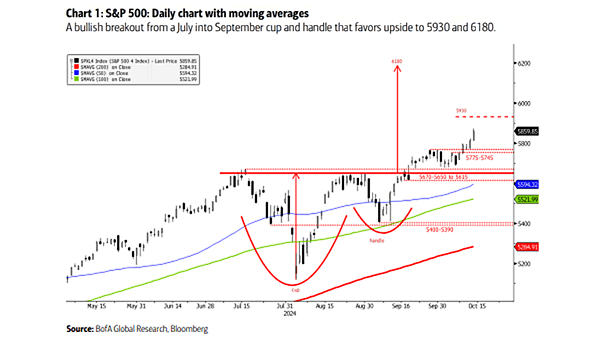
S&P 500 Daily Chart The cup and handle breakout suggests a bullish trend, implying that the S&P 500 index could experience upward movement, with target levels of 5930 and 6180. Image: BofA Global Research
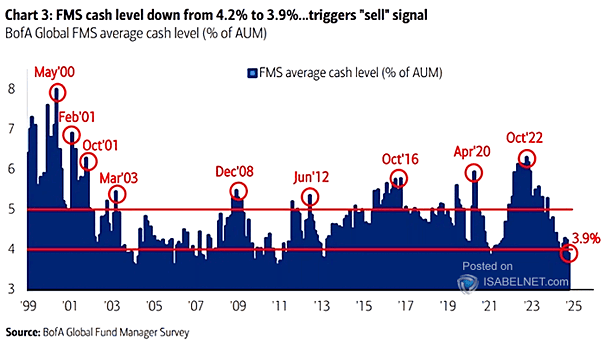
FMS Average Cash Balance The FMS cash level’s recent decline to 3.9% has generated a contrarian sell signal for global equities. Historically, these signals often precede market corrections, prompting investors to reassess their strategies. Image:…
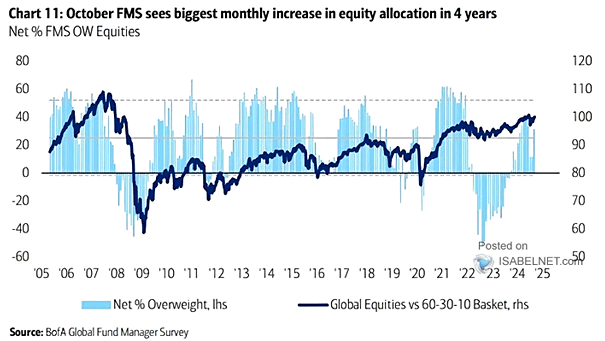
Equities – FMS Global Equity Allocation FMS investors significantly increased their equity allocation in October, the largest rise since June 2020. This shift is primarily due to a favorable economic climate resulting from the easing…