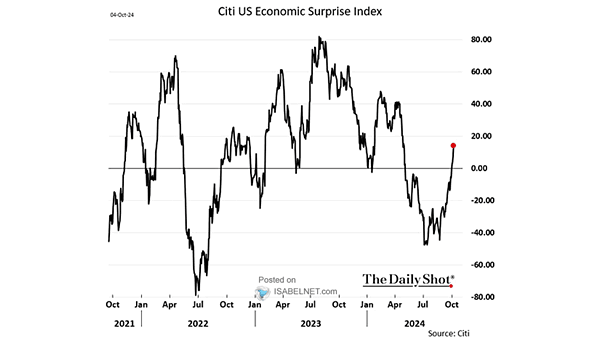
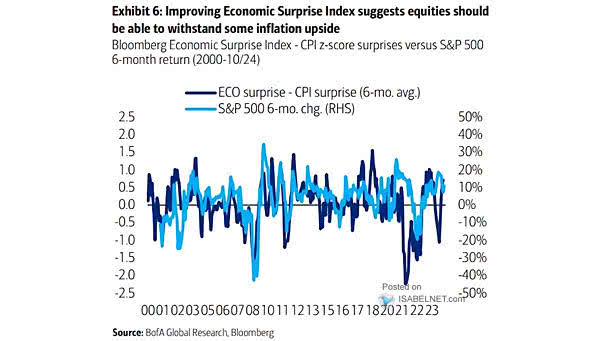
30-Year U.S. Treasury Total Return Index

30-Year U.S. Treasury Total Return Index Over the past four years, 30-year U.S. Treasury bonds have experienced their worst loss in over a century, with a decline of 54% in total return. Image: BofA Global…

S&P 500 and U.S. IPO Activity

S&P 500 and U.S. IPO Activity The increased IPO activity in the United States, combined with the positive trends in global markets, suggests a potentially bullish medium-term outlook for IPOs as market conditions continue to…

Sentiment – U.S. Put Call Ratio Composite

Sentiment – U.S. Put Call Ratio Composite A relatively low put/call ratio is often interpreted as a sign of heightened bullish sentiment or greed in the market, which is frequently viewed as a contrarian indicator.…

Inflation – U.S. CPI Forecasts

Inflation – U.S. CPI Forecasts With inflation high, the Fed’s interest rate cut decisions require a delicate balance between price stability, economic expansion and employment support. Image: BofA Global Investment Strategy

S&P 500 – Largest 7 Stocks vs. Rest of Index

S&P 500 – Largest 7 Stocks vs. Rest of Index Investing heavily in the largest seven U.S. stocks in a portfolio tends to underperform the rest of the S&P 500 index over the long term,…

Valuation – S&P 500 Long-Term P/E Ratio

Valuation – S&P 500 Long-Term P/E Ratio Valuation, particularly in the context of the S&P 500’s long-term P/E ratio, is a significant consideration for investors. The high current ratio suggests potential overvaluation. Image: The Daily…

U.S. 2-Year Treasury Yield – Weekly Chart

U.S. 2-Year Treasury Yield – Weekly Chart Technical analysis suggests that the 2-year U.S. Treasury yield is projected to decline by the end of 2024, with a potential target between 3.50% and 3.29%. Image: BofA…

The Five Largest Stocks in the S&P 500

The Five Largest Stocks in the S&P 500 The concentration of the S&P 500 in the 5 largest stocks is higher than it was 60 years ago, which is considered a potential risk, as it…