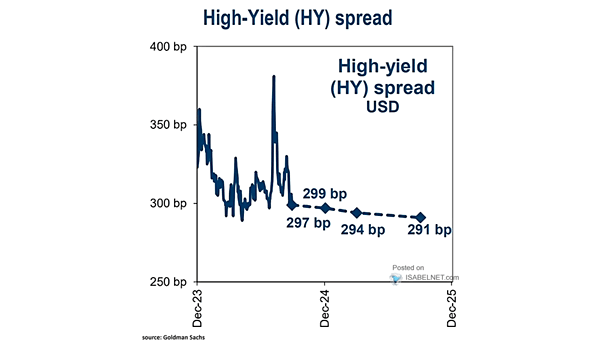
U.S. 2-Year Treasury Yield – Weekly Chart

U.S. 2-Year Treasury Yield – Weekly Chart Technical analysis suggests that the 2-year U.S. Treasury yield is projected to decline by the end of 2024, with a potential target between 3.50% and 3.29%. Image: BofA…

The Five Largest Stocks in the S&P 500

The Five Largest Stocks in the S&P 500 The concentration of the S&P 500 in the 5 largest stocks is higher than it was 60 years ago, which is considered a potential risk, as it…

Fed – The Distribution of FOMC Voters

Fed – The Distribution of FOMC Voters Should investors bet for a hawkish Fed policy tone in 2025, as the central bank remains focused on its fight against persistent inflation, even if it means risking…

Global Policy Rate Hikes

Global Policy Rate Hikes In June 2024, for the first time since October 2020, no major central banks around the world raised interest rates, marking a significant shift in global monetary policies. Image: BofA Global…

S&P 500 Index Relative to Historic Valuation Ranges

S&P 500 Index Relative to Historic Valuation Ranges The fact that U.S. markets are trading significantly above their typical valuation levels suggests that the expected outcomes may not be as optimistic as many investors anticipate.…

U.S. Government Total Outlays

U.S. Government Total Outlays U.S. federal government spending has risen sharply since the 2020s, sparking debates about fiscal responsibility and the long-term implications for the U.S. economy. Image: BofA Global Investment Strategy

Top 10 Stocks as % of S&P 500

Top 10 Stocks as % of S&P 500 In recent years, there has been a substantial rise in concentration among the top 10 companies in the S&P 500, which has raised concerns about potential risks…

Seasonality Trends in MSCI AC World Index (Global Equities)

Seasonality Trends in MSCI AC World Index (Global Equities) July has historically been a strong month for global equities, offering opportunities for investors to capture potential gains. Image: BofA Global Quantitative Strategy