ISABELNET Cartoon of the Day
ISABELNET Cartoon of the Day The S&P 500’s performance since the end of the 2022 bear market has rewarded bullish investors, contradicting pessimistic forecasts. It’s already Wednesday, Happy “Hump” Day, Everyone! 🐫🐪😎
ISABELNET Cartoon of the Day The S&P 500’s performance since the end of the 2022 bear market has rewarded bullish investors, contradicting pessimistic forecasts. It’s already Wednesday, Happy “Hump” Day, Everyone! 🐫🐪😎
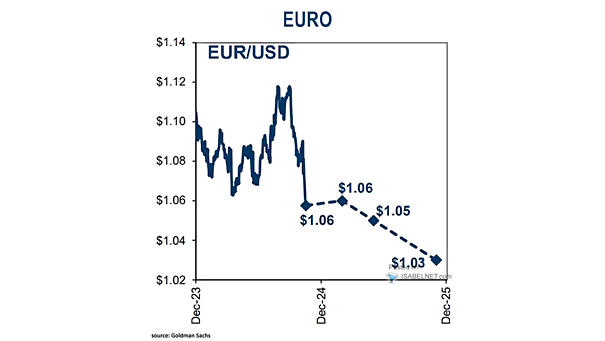
Euro to U.S. Dollar (EUR/USD) Goldman Sachs holds a pessimistic view on the EUR/USD currency pair, indicating that the euro is expected to depreciate against the U.S. dollar over the next 3 to 6 months.…
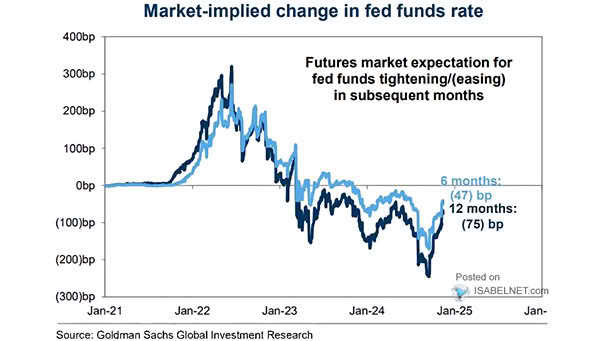
Market-Implied Change in Fed Funds Rate Traders are anticipating a total of 75 bps in interest rate cuts by the Federal Reserve over the next 12 months. Image: Goldman Sachs Global Investment Research
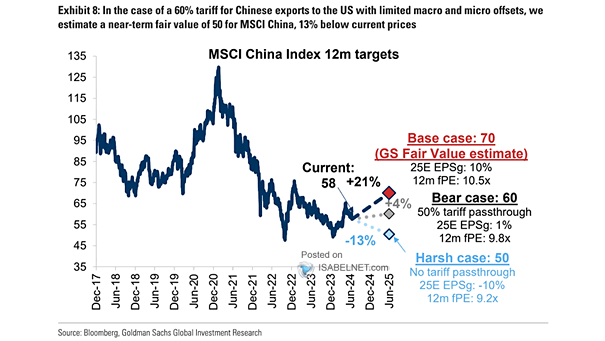
Stocks – MSCI China Index 12-Month Targets Persistent deflation and geopolitical tensions have led Goldman Sachs to take a more cautious stance on Chinese equities and their earnings potential. Image: Goldman Sachs Global Investment Research

ISABELNET Cartoon of the Day Bears can’t stop laughing as gold trades near a two-month low. But Goldman Sachs predicts gold will hit a record high of $3,000 per ounce by December 2025, driven by…
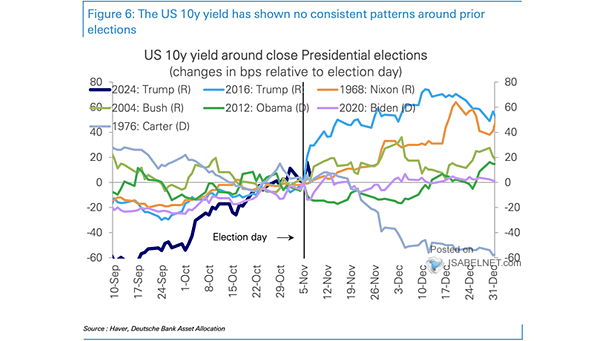
U.S. 10-Year Treasury Yield Around Close Presidential Elections While U.S. elections are significant in shaping economic policy and affecting investor sentiment, they do not consistently drive changes in the U.S. 10-year Treasury yield. Image: Deutsche…
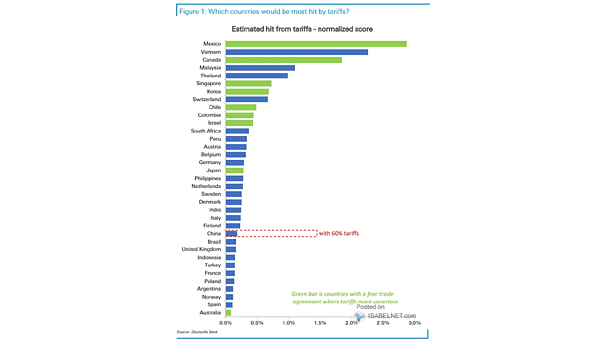
Which Countries Would Be Most Hit by Tariffs? Mexico, Vietnam, and Canada stand to lose the most if the United States implements new tariffs, given their strong economic relationships with the U.S.. Image: Deutsche Bank
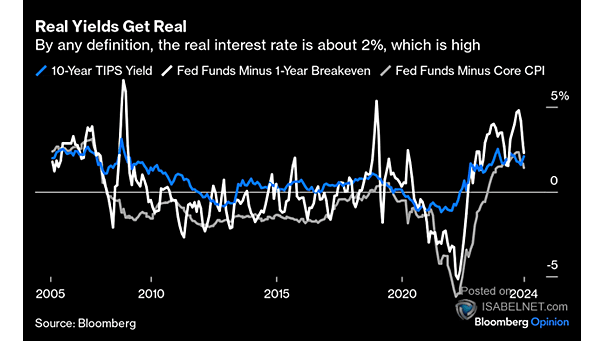
U.S. Real Yields While not extreme, the current U.S. real interest rate of about 2% is relatively high, reflecting a restrictive monetary policy aimed at bringing inflation under control. Image: Bloomberg

ISABELNET Cartoon of the Day Being a bear on Earth in 2024 is hard enough, with the S&P 500 gaining 26% YTD including dividends. How about a one-way trip to Mars? It’s so cold there…
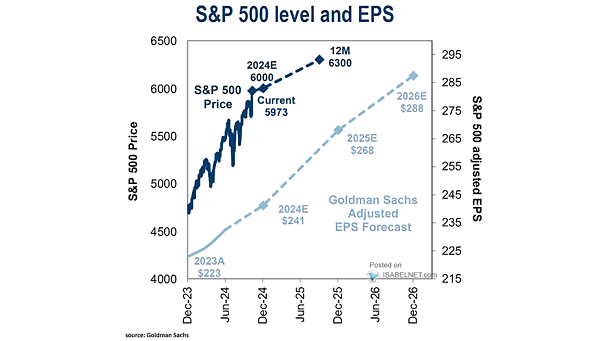
S&P 500 Level and EPS Driven by expectations of robust earnings per share growth, Goldman Sachs has set its 12-month S&P 500 price target at 6,300. Image: Goldman Sachs Global Investment Research

ISABELNET Cartoon of the Day With Republicans achieving a trifecta by winning the House, Senate, and presidency, Democrats will find it difficult to advance their policy agenda. Historically, markets have performed best under a divided…