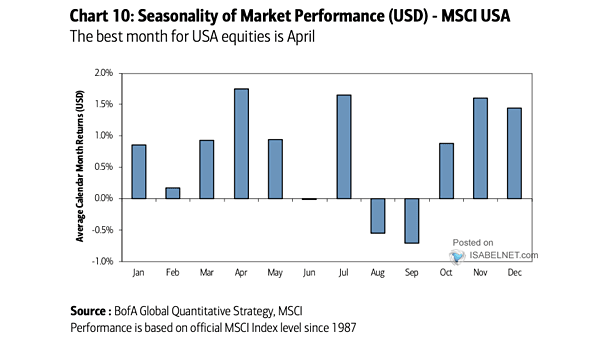
Seasonality of Market Performance – MSCI USA
Seasonality of Market Performance – MSCI USA August and September have historically been less favorable months for U.S. equities, with lower average performance compared to other months. Image: BofA Global Quantitative Strategy