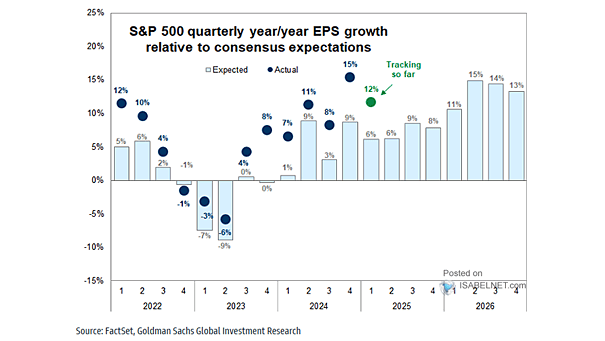
PEG Ratio between Technology and Global Aggregate Market

PEG Ratio between Technology and Global Aggregate Market The tech sector’s slump is beginning to uncover compelling opportunities, with valuations now lagging behind the global aggregate market despite solid growth expectations. Times like these often…

S&P 500 Annualized Return per Day

S&P 500 Annualized Return per Day The 2026 playbook feels familiar: U.S. stocks push higher through midweek before traders take profits and trim exposure ahead of the weekend. It has become pretty much the market’s…

Estimated Share of S&P 500 EPS Growth

Estimated Share of S&P 500 EPS Growth AI infrastructure spending is expected to drive about 40% of S&P 500 earnings growth this year, and around 28% in 2027. It’s a strong tailwind for profits today,…

AAII Asset Allocation

AAII Asset Allocation Signs of caution are surfacing among U.S. retail investors, who cut their stock holdings for a fourth straight month in March while trimming bond positions and parking more money in cash. Many…

Bond Volatility – MOVE Index

Bond Volatility – MOVE Index With the MOVE index trending lower, U.S. rate volatility has cooled, which brings a dose of relief to bond desks and, by extension, the economy. It’s definitely a welcome breather…

60/40 Portfolio Monthly Return Decomposition

60/40 Portfolio Monthly Return Decomposition The classic 60/40 portfolio slid 3.7% in March as stocks and bonds dropped in tandem. Such lockstep declines aren’t unusual when markets brace for higher prices or sticky inflation ahead.…

Positioning Across Sector Groups

Positioning Across Sector Groups Investors are keeping exposure light across most sectors, with only Energy and Utilities still drawing interest. That’s hardly surprising, as Energy remains the market’s only bright spot. Image: Deutsche Bank Asset…

S&P 500 Monthly Performance the Past 20 Years

S&P 500 Monthly Performance the Past 20 Years This year’s conflict in the Middle East has clouded the outlook, but history still favors the bulls: April has rewarded U.S. stocks 80% of the time over…

S&P 500 – 13-Week and 26-Week Moving Average

S&P 500 – 13-Week and 26-Week Moving Average The S&P 500 remains in a bull trend with the 13-week moving average still above the 26-week, but the gap has narrowed enough to raise caution. Image:…