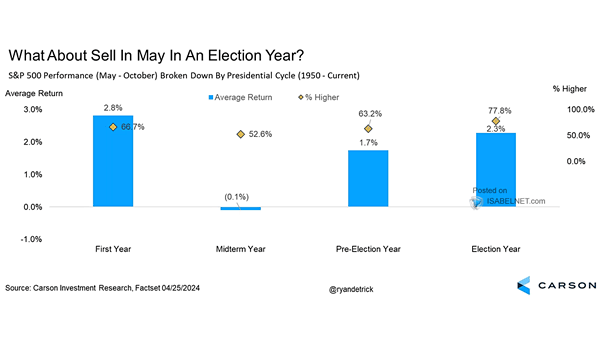
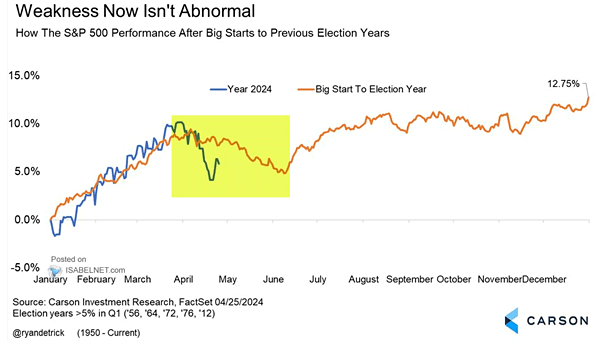
Market – Short Sellers Gains/Losses

Market – Short Sellers Gains/Losses Market conditions and unexpected events have made short selling a difficult year, with over $145 billion in losses incurred. Image: CNBC

S&P 500 Total Return and Historical Inflation Peaks

S&P 500 Total Return and Historical Inflation Peaks Historically, U.S. stocks have shown a tendency to increase when there is no recession following a peak in inflation. Image: Goldman Sachs Global Investment Research

Cumulative Inflows Across Asset Classes

Cumulative Inflows Across Asset Classes Cash is the flow winner in 2023. Will it serve as the driving force behind the bull markets of 2024? Image: BofA Global Investment Strategy

Average S&P 500 Returns by Election Cycle Year

Average S&P 500 Returns by Election Cycle Year The dynamics and uncertainties of the electoral process often impact market performance in presidential election years, leading to a historical trend of weaker S&P 500 returns. Image:…

Total Return Performance Since First Fed Hike in March 2022

Total Return Performance Since First Fed Hike in March 2022 There has been a significant concentration of equity market returns following the first Fed hike in March 2022. This concentration should be considered by investors…

Net % Investors Say They Are Overweight Bonds

Net % Investors Say They Are Overweight Bonds FMS investors currently have their largest overweight position in bonds since the global financial crisis, indicating their strong confidence in lower inflation and yields for the year…

Fed Funds Rate and Dow Jones Index

Fed Funds Rate and Dow Jones Index In the same way as it was in the 1970s, it’s all about the Federal Reserve. Image: BofA Global Investment Strategy

Valuation – S&P 500 Price/Earnings Ratio

Valuation – S&P 500 Price/Earnings Ratio The S&P 500 P/E multiple is expected to remain above the average level observed since 1990, indicating investors’ willingness to pay more for earnings, possibly due to optimism about…