S&P 500 Index Returns In April
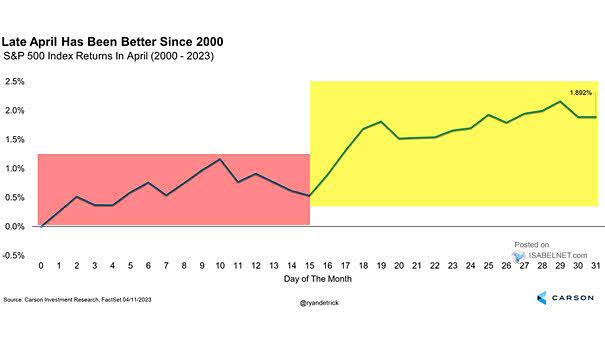
S&P 500 Index Returns In April Since 2000, the second half of April has generally shown strong performance for U.S. stocks. Image: Carson Investment Research
S&P 500 Index Returns In April Since 2000, the second half of April has generally shown strong performance for U.S. stocks. Image: Carson Investment Research
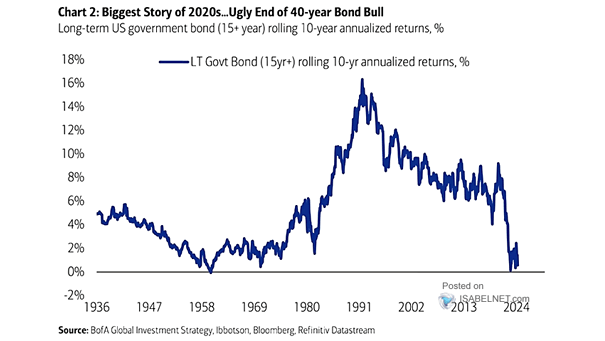
U.S. Long-Term Government Bond Returns The 10-year annualized return from U.S. Treasuries is at a 65-year low of just 0.6%, prompting investors to reassess portfolio allocation and risk management strategies. Image: BofA Global Investment Strategy
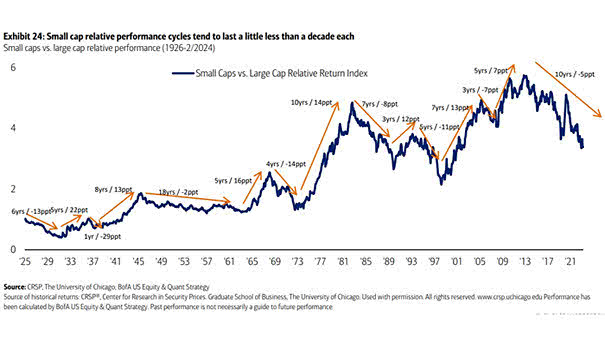
Small Cap Stocks vs. Large Cap Stocks Relative Performance Is it time for U.S. equity investors to increase their allocation to small-cap stocks compared to large-cap stocks in their portfolio? Image: BofA US Equity &…
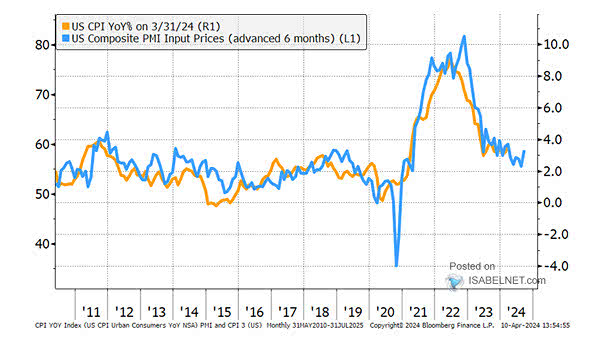
U.S. Consumer Prices Index vs. U.S. Composite PMI Input Prices (Leading Indicator) U.S. Composite PMI Input Prices tend to lead U.S. CPI by 6 months, reflecting the impact of changes in input prices on consumer…
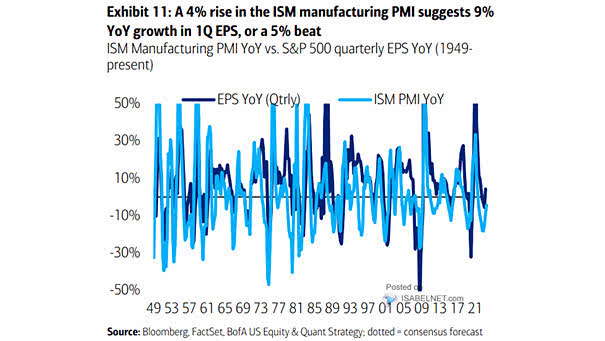
U.S. ISM Manufacturing PMI vs. S&P 500 EPS Growth A rise in the U.S. ISM manufacturing PMI is suggesting positive growth in 1Q EPS, with expectations of outperforming the initial projections. Image: BofA US Equity…
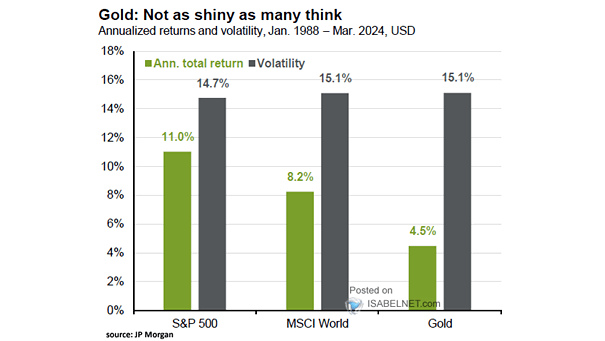
Gold Annualized Returns and Volatility While gold has had periods of significant growth and can serve as a hedge against inflation, historical data suggests that equities have generally outperformed gold over the long term. Image:…
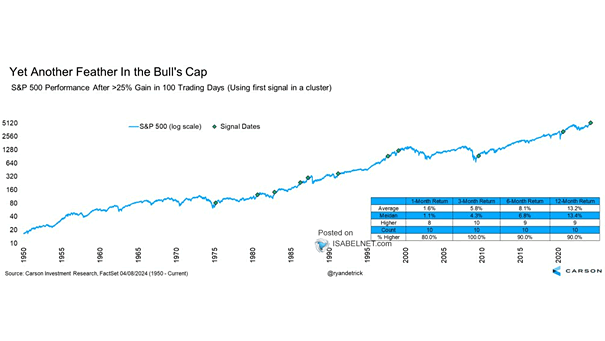
S&P 500 Performance After >25% Gain in 100 Trading Days An increase of 25% or more in the S&P 500 within 100 days (using the first signal in a cluster) suggests a positive outlook for…
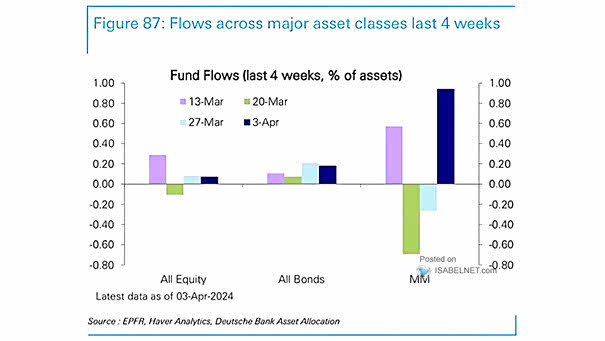
Weekly Fund Flows The strong flows into money market funds reflect the attractiveness of these funds to investors seeking relatively stable returns in the current market environment. Image: Deutsche Bank Asset Allocation
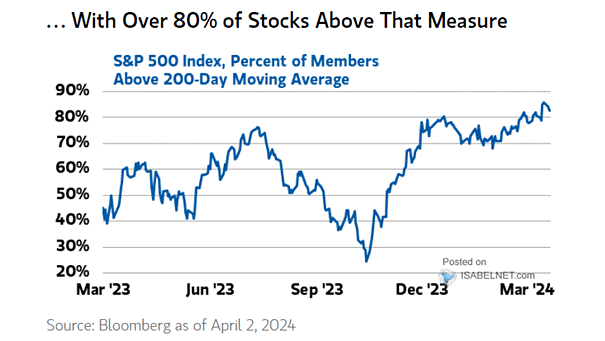
S&P 500 and Percent of S&P 500 Members Above Their 200-Day Moving Average The expansion of market breadth in the U.S. stock market indicates a broader participation of stocks in the market movement, suggesting potential…
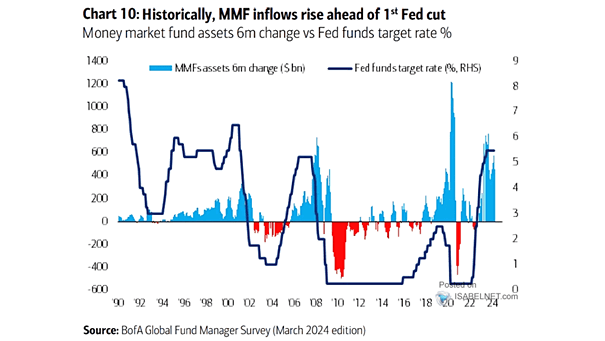
Money Market Fund Assets vs. Fed Funds Target Rate Money market funds often experience outflows 12 months after the initial rate cut. This occurs as investors reallocate their investments and adjust their risk exposure in…
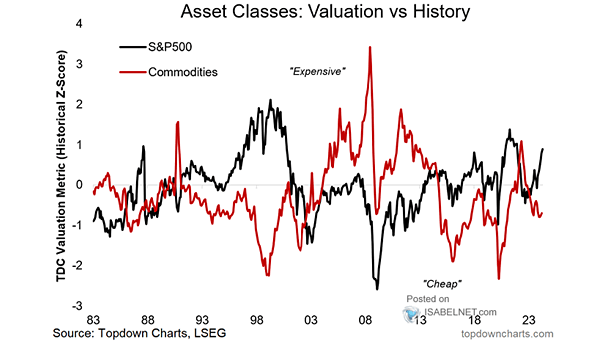
Asset Classes – Valuation vs. History The current market environment reflects a contrast between relatively cheap commodities and expensive U.S. stock valuations. Image: Topdown Charts